Just FYI … Slow download of offline charts issue continues with build 50. Update of previously downloaded charts of 82600 tiles required 4+ hours at 120 to 200 mbps on iPhoneX with 28 gb free storage and screen lock disabled.
We have not made any changes to Coastal Explorer that will improve this yet. I expect this work to take at least several more weeks, possibly much longer.
What is considered a small vs. large area for download?
Recently I had to reinstall the whole CE on my iPad. I then proceeded to download the charts. After a few tries I reduced the area to just Puget Sound up to US/Canada border and not including west entrance to Juan de Fuca. This still does not downloads at all. The CE crashes in the middle of the download attempt. I tried 3 times and sent all crash reports.
Interestingly when using online charts on the same WiFi network, they get pulled in very smoothly.
Regards,
Maciek
Well, that took longer than I expected… However, we have made some good progress on the performance of downloading charts for offline use.
Raster charts are now significantly smaller and faster to download, but the only way we could achieve that was to remove some of detail at large scales. We did not think this was ideal, so we tried a number of other ideas, but only one really worked out…
And that was to add vector charts! We always intended to add vector charts to Coastal Explorer on the iPhone and iPad, but knew it would be a huge project so planned on doing it sometime after releasing the app. With all the problems we found with raster charts, though, we decided we couldn’t wait.
The vector chart downloads are much smaller (and faster) than the raster downloads, and vector charts have many other benefits as well. Be sure to install Build 55 with TestFlight to use these new charts!
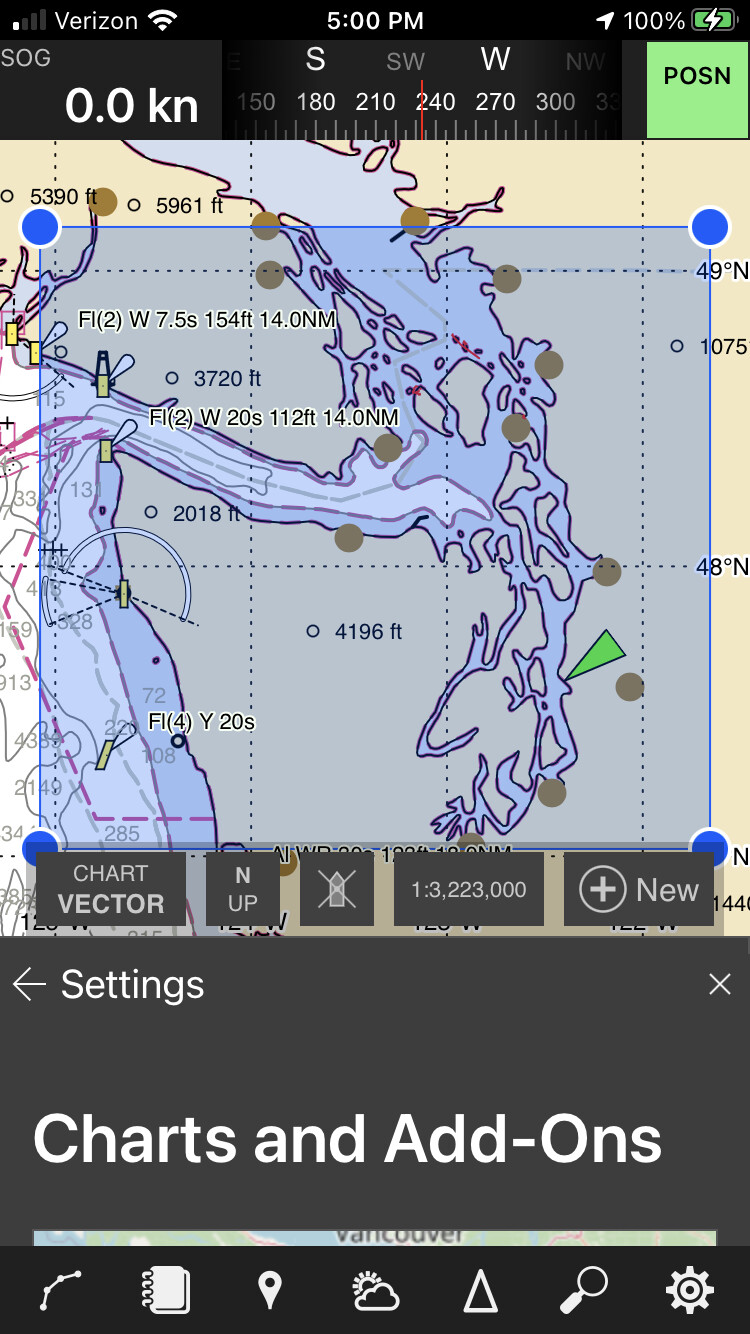
If you want to download an area for offline use, use “Settings > Charts and Add-Ons”, then Edit your options to include “NOAA ENC Vector Charts” (you might also want to disable “NOAA RNC Raster Charts” while you’re there).
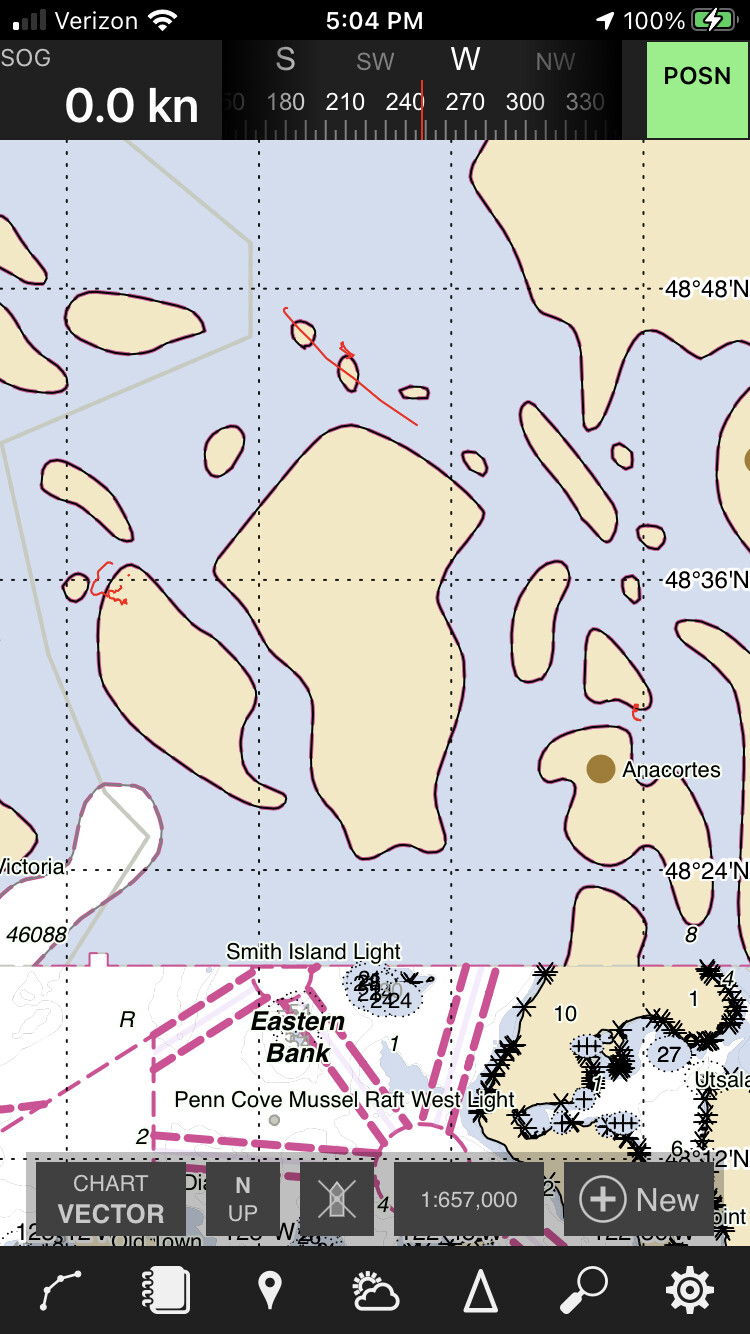
I have Build 55 on my iphone. I like the Vector Charts, but find that I have odd scale problems with the vector charts downloaded for use offline. In various areas, small shale or large scale charts don’t show up. For example, there are 1:25000 ENCs covering Sucia Island, but I see nothing larger than about 1:80000. In other areas like Anacortes, 1:25000 shows up fine, but nothing between 1:40000 and 1:80000. At scales smaller than 1:679000, everything north of Smith Island disappears (reverts to the cartoon background chart).
Also, is there a way to use the “charts here” feature of PC Coastal Explorer?
I’m not sure why you aren’t seeing charts at some scales… I’ve downloaded an area that covers all the places you mentioned and they look fine at all scales. It is possible that all of the downloads didn’t work for you for some reason, and errors are not yet reported. You might try using the “Settings > Update Now” button again to retry the downloads and see if that fixes it.
The “Charts Here” feature is not possible with this format of chart as the charts are all being combined in such a way that overlapped areas are removed from the data.
I had tried the “Update Now” button a couple of times, and just did so again. No change in the problem.
Not sure I mentioned, but there is no problem with online vector charts, just the ones I downloaded for use off line.
Frank
Would you mind submitting a screenshot or two, either with the TestFlight feedback feature, or posted here? Then I can look at exactly the same places and scales you’re seeing problems. Ideally this would include the Charts and Add-Ons screen so I can try downloading the same area as you, and a place where you are seeing a problem.
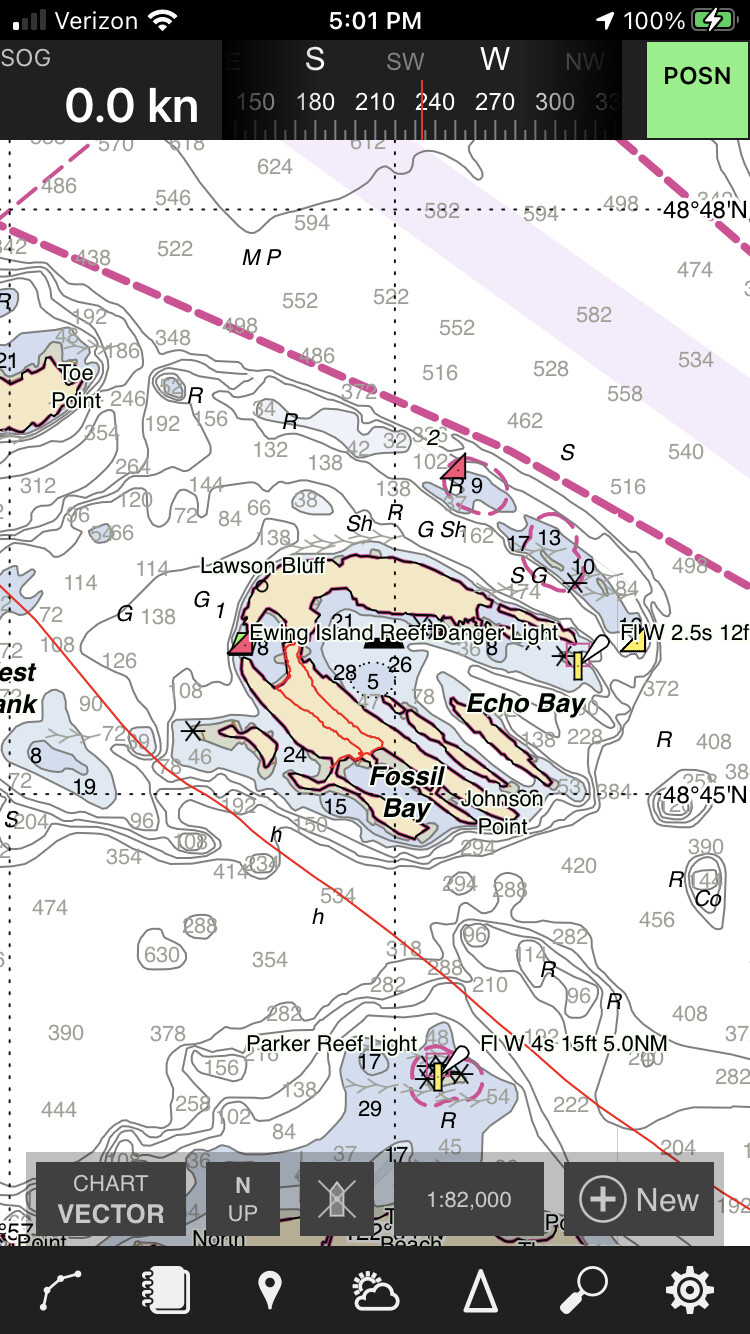
I found that updating in Test Flight, as opposed to opening Coastal Explorer directly, seem to fill in the larger scale charts near Sucia. There is still a gap between about 1:78000 and 1:40000 everywhere and smaller than 1:600000 north of Smith Island.
Hope the screen shots help.
Regards, Frank
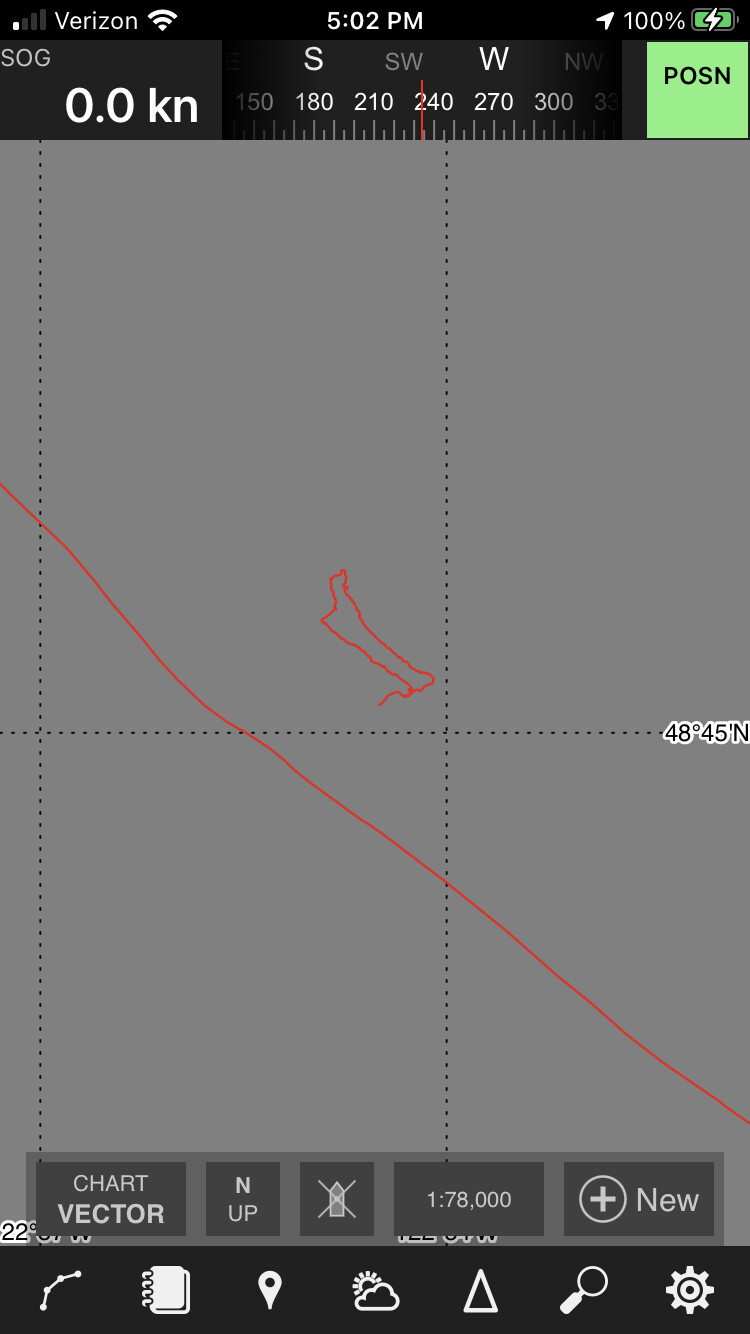
Thanks for the screenshots! There are a couple of different things going on here:
In your 1:78,000 scale shot, it appears that the download for files at that zoom didn’t work. I’m not sure why retrying the download didn’t fix this, but it’s possible that we have a problem where some types of errors aren’t handled correctly and could prevent future downloads of affected areas. We are planning one more change to the download mechanism that will include better verification of the received files, and hopefully that will fix this for you. In the mean time, it’s possible that uninstalling and re-installing the app and then re-downloading the charts will fix this.
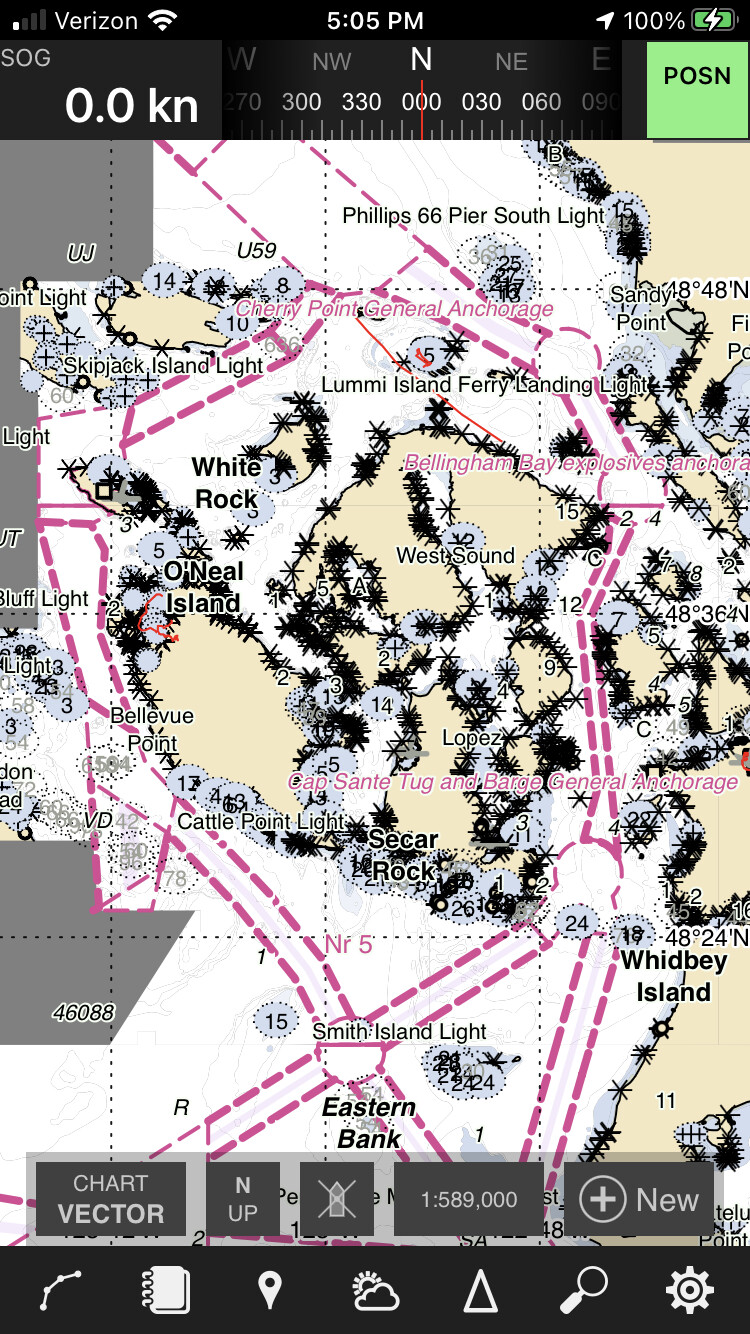
In your 1:657,000 scale shot, the incredibly low resolution blobs pretending to be islands are part of NOAA’s overview chart which is actually closer in scale to 1:657,000 than the much higher resolution chart you can see in your 1:589,000 shot. At both of these viewing scales, neither chart is particularly well suited for display but are the best available. NOAA is currently refactoring all of their charts in order to provide more consistent data at various scales and we hope this will be fixed as part of that process. We might also be able to make some improvements in our use of the existing data, but that is probably not something we’ll be able to get to right away. Luckily this sort of thing doesn’t appear to happen in very many places, and when it does, zooming in a little fixes the display.
Thanks. I’ll try the uninstall/reinstall and see if that helps. I had thought to delete the downloaded charts, before redownloading them, but I couldn’t figure out how to do the delete.
Regarding the 1:657000 view, my question is about the chart displayed south of Smith Island compared to what is shown to the north. When I look at it on my PC the “charts here” indicates two CA charts at 1:262000 and a US chart at 1:3500000.Either CA chart has detail covering both north and south of Smith Island, but is only added to the quilt south of Smith Island, with the 1:3500000 chart displayed to the north. On the PC both CA charts drop out at 1:1000000.
Regards, Frank
CHS does produce a few charts that cover parts of the US (and NOAA produces a few charts that cover parts of Canada). In this area, NOAA did produce a couple of charts at a medium scale that covered the San Juan Islands up until 2013 when they discontinued them due to IHO rules about not having overlapping chart coverage at particular scale bands. Unfortunately it was decided back then that CHS would become responsible for those charts even though that meant that coverage would no longer be freely available.
Once we have an agreement with CHS to offer their charts on the iPad and iPhone, the display in this area should be more like it is on the PC
I did the uninstall/reinstall. Problem with downloaded vector charts seems worse. I used the feedback system on Testflight to send you a screenshot.
Regards, Frank
The next update will include a way to see errors that happen during the download… Hopefully that will help us get to the bottom of this.
We released Build 55.1 last night and it includes the error log I mentioned. However, we also made some major changes to how the chart files are downloaded that will help optimize future updates to the data. It’s possible that those changes will also affect the initial download (hopefully in a positive way).
If any problems occur during an update, Coastal Explorer will now show a red message near the “OFFLINE DATA UPDATED” message that indicates how many errors occurred. Tapping Update Now again will then try to download only the parts that failed before.
Please give this new build a try and let me know how it goes!
Thanks Brad.
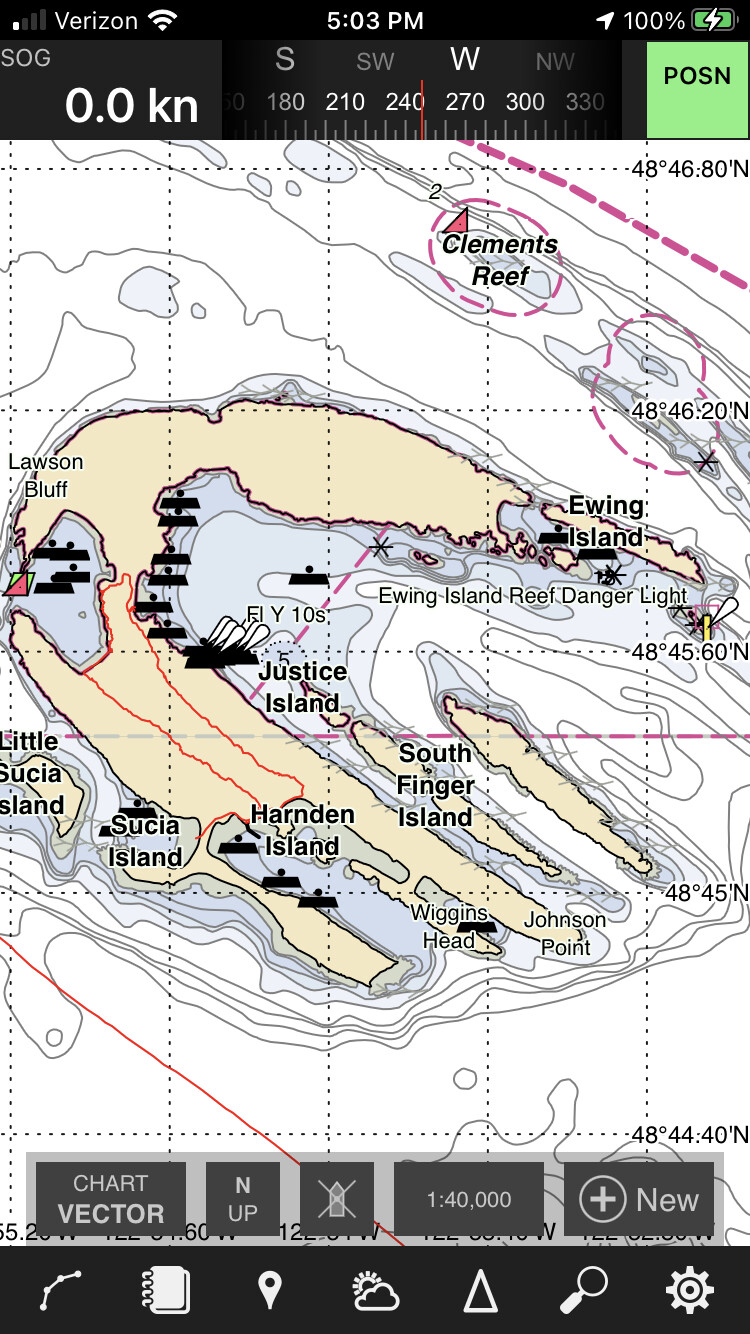
55.1 works much better. I got the vector chart download with no error messages. The chart scaling is smooth and I get the larger scale charts I was missing.
I look forward to the CA charts in the future.
That’s great news, thanks!