I recently purchased and installed C-Maps on my CE running on a Win10 machine. I sometimes receive the ‘C-Map charts not available for this region’ (not sure of the exact wording here but it should be close) C-Map notification and a generic chart is displayed with no detail. Sometimes I can resume with proper C-Map chart display by switching to vector charts and then back to C-Map charts. Any clue?
Hello!
Please send a screenshot of the entire screen when you get the error message since that may give us a clue on what’s going on here. Thank you!
I have the same issue, but only occurs when I zoom in too far on C-map chart. Try zooming out, and see if the message goes away.
I had a 2016 version of C-MAP that have I’ve been using for a number of years with CE. The message “No C_MAP charts are available for this area scale” continues to report intermittently no matter what scale is selected. I took a chance and upgraded to the 2020 version of the C-Maps that CE is currently offering. This issue is still problematic. We are rerunning on multiple Window 11 PC’s. The upgrade was $169. If I can’t get a resolution, I would request a credit back for the upgraded C-Map cartography please? See upload screen capture attached.
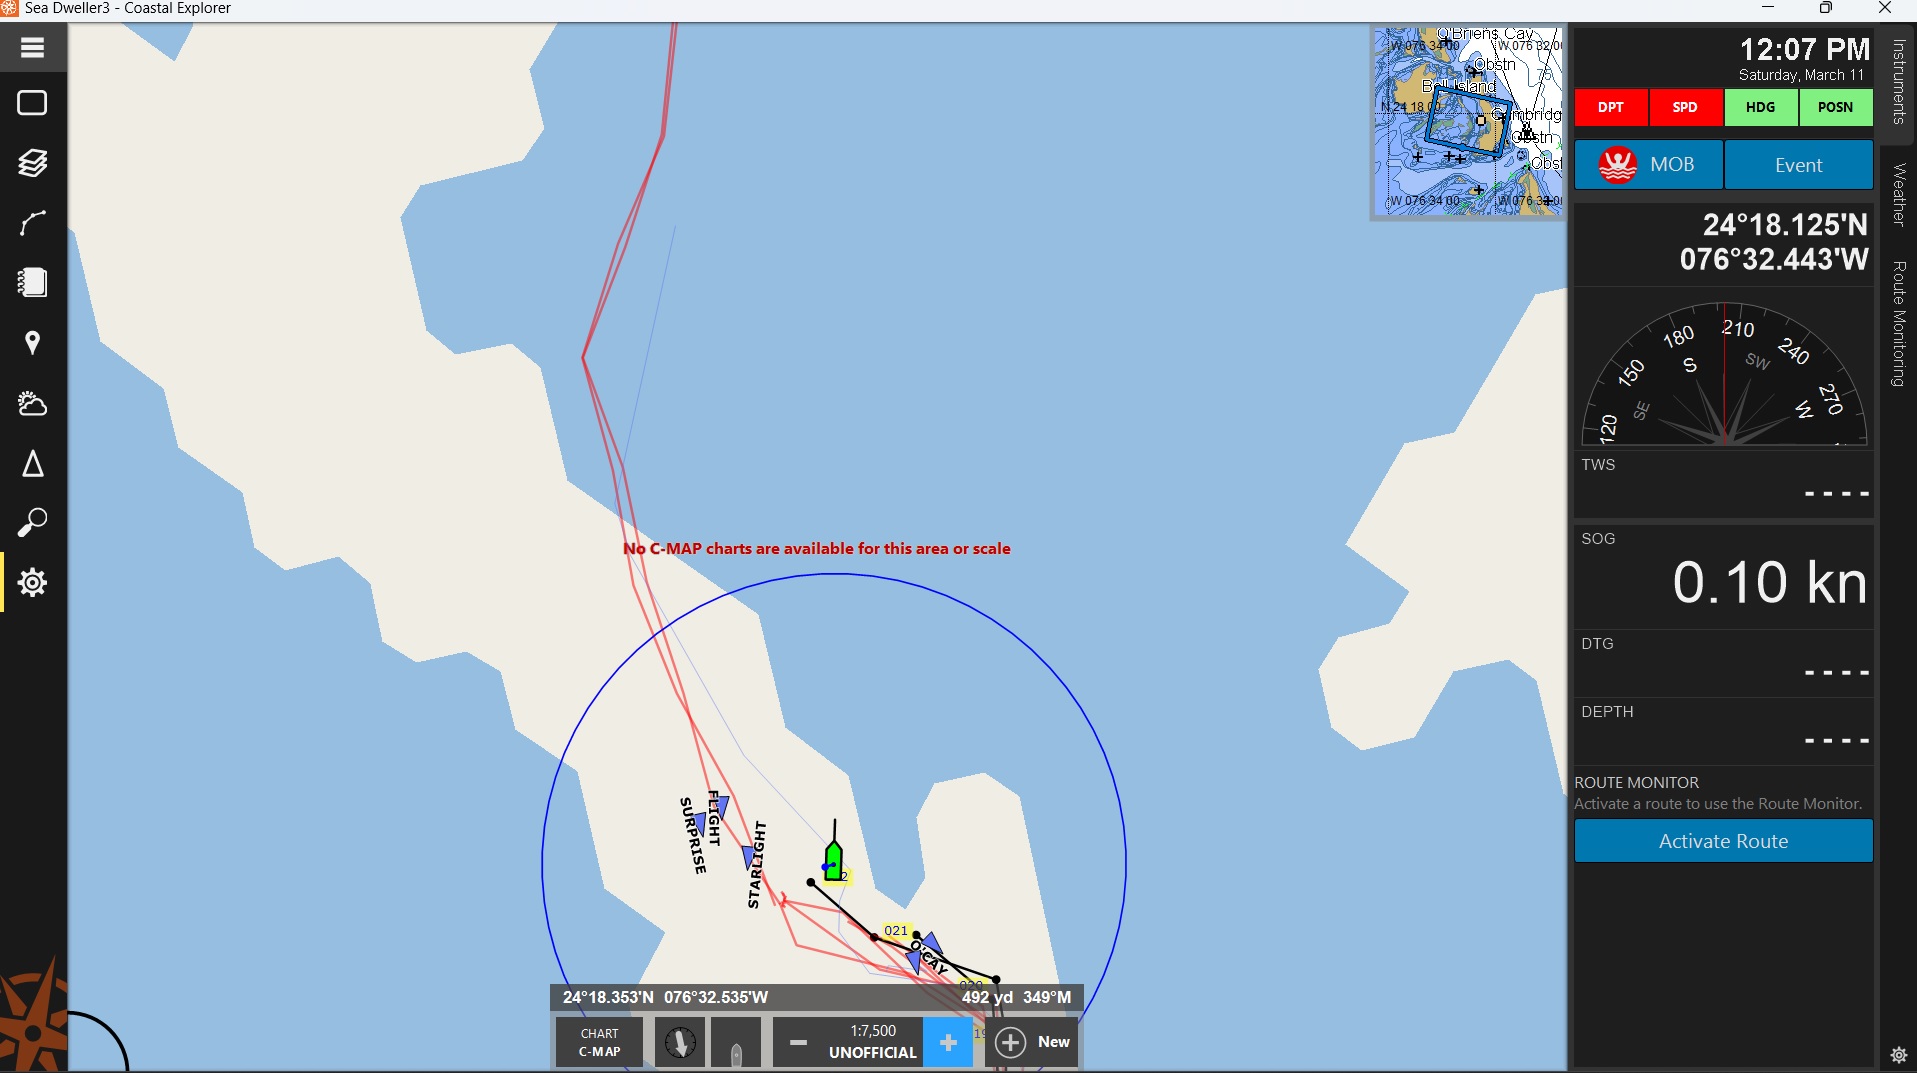
Yes, we’re familiar with this problem. Unfortunately, the C-MAP MAX PC chart engine was written long ago by C-MAP and has issues with higher resolution displays, where it will sometimes not draw charts at certain viewing scales. The behavior varies greatly depending on the intended viewing scale of the underlying chart layer being drawn.
You have three choices for dealing with this since we can do nothing to solve the problem:
- Zoom to a scale where the charts do display.
- Unmaximize Coastal Explorer and size the application Window to a small enough size to get reliable chart drawing at the viewing scales where this happens. Yes, you can set your screen resolution lower too, but, as you say, you’d have to switch it back/forth for when you want to view media, which is awkward and inconvenient. Also, displaying at a non-native resolution doesn’t always look crisp.
- Set Coastal Explorer to use a split chart display, making each chart display smaller and, therefore, a lower resolution. This can be done via the Screens button at the left, where you can configure a screen with 1, 2 , 3, or 4 chart panels. This is roughly equivalent to using a non-maximized and manually sized application window but lets you keep CE maximized.
I hope this helps.
Regards,
–
Steven J. Hodgen
Senior Support Engineer
Rose Point Navigation Systems
425-605-0985
What ist the maximum resolution of the monitor so that the problem does not occur ?
I don’t know what resolution would avoid the problem entirely, just that the lower the resolution the less frequent the problem. The problem is made worse by the extremely high resolution of many modern displays.