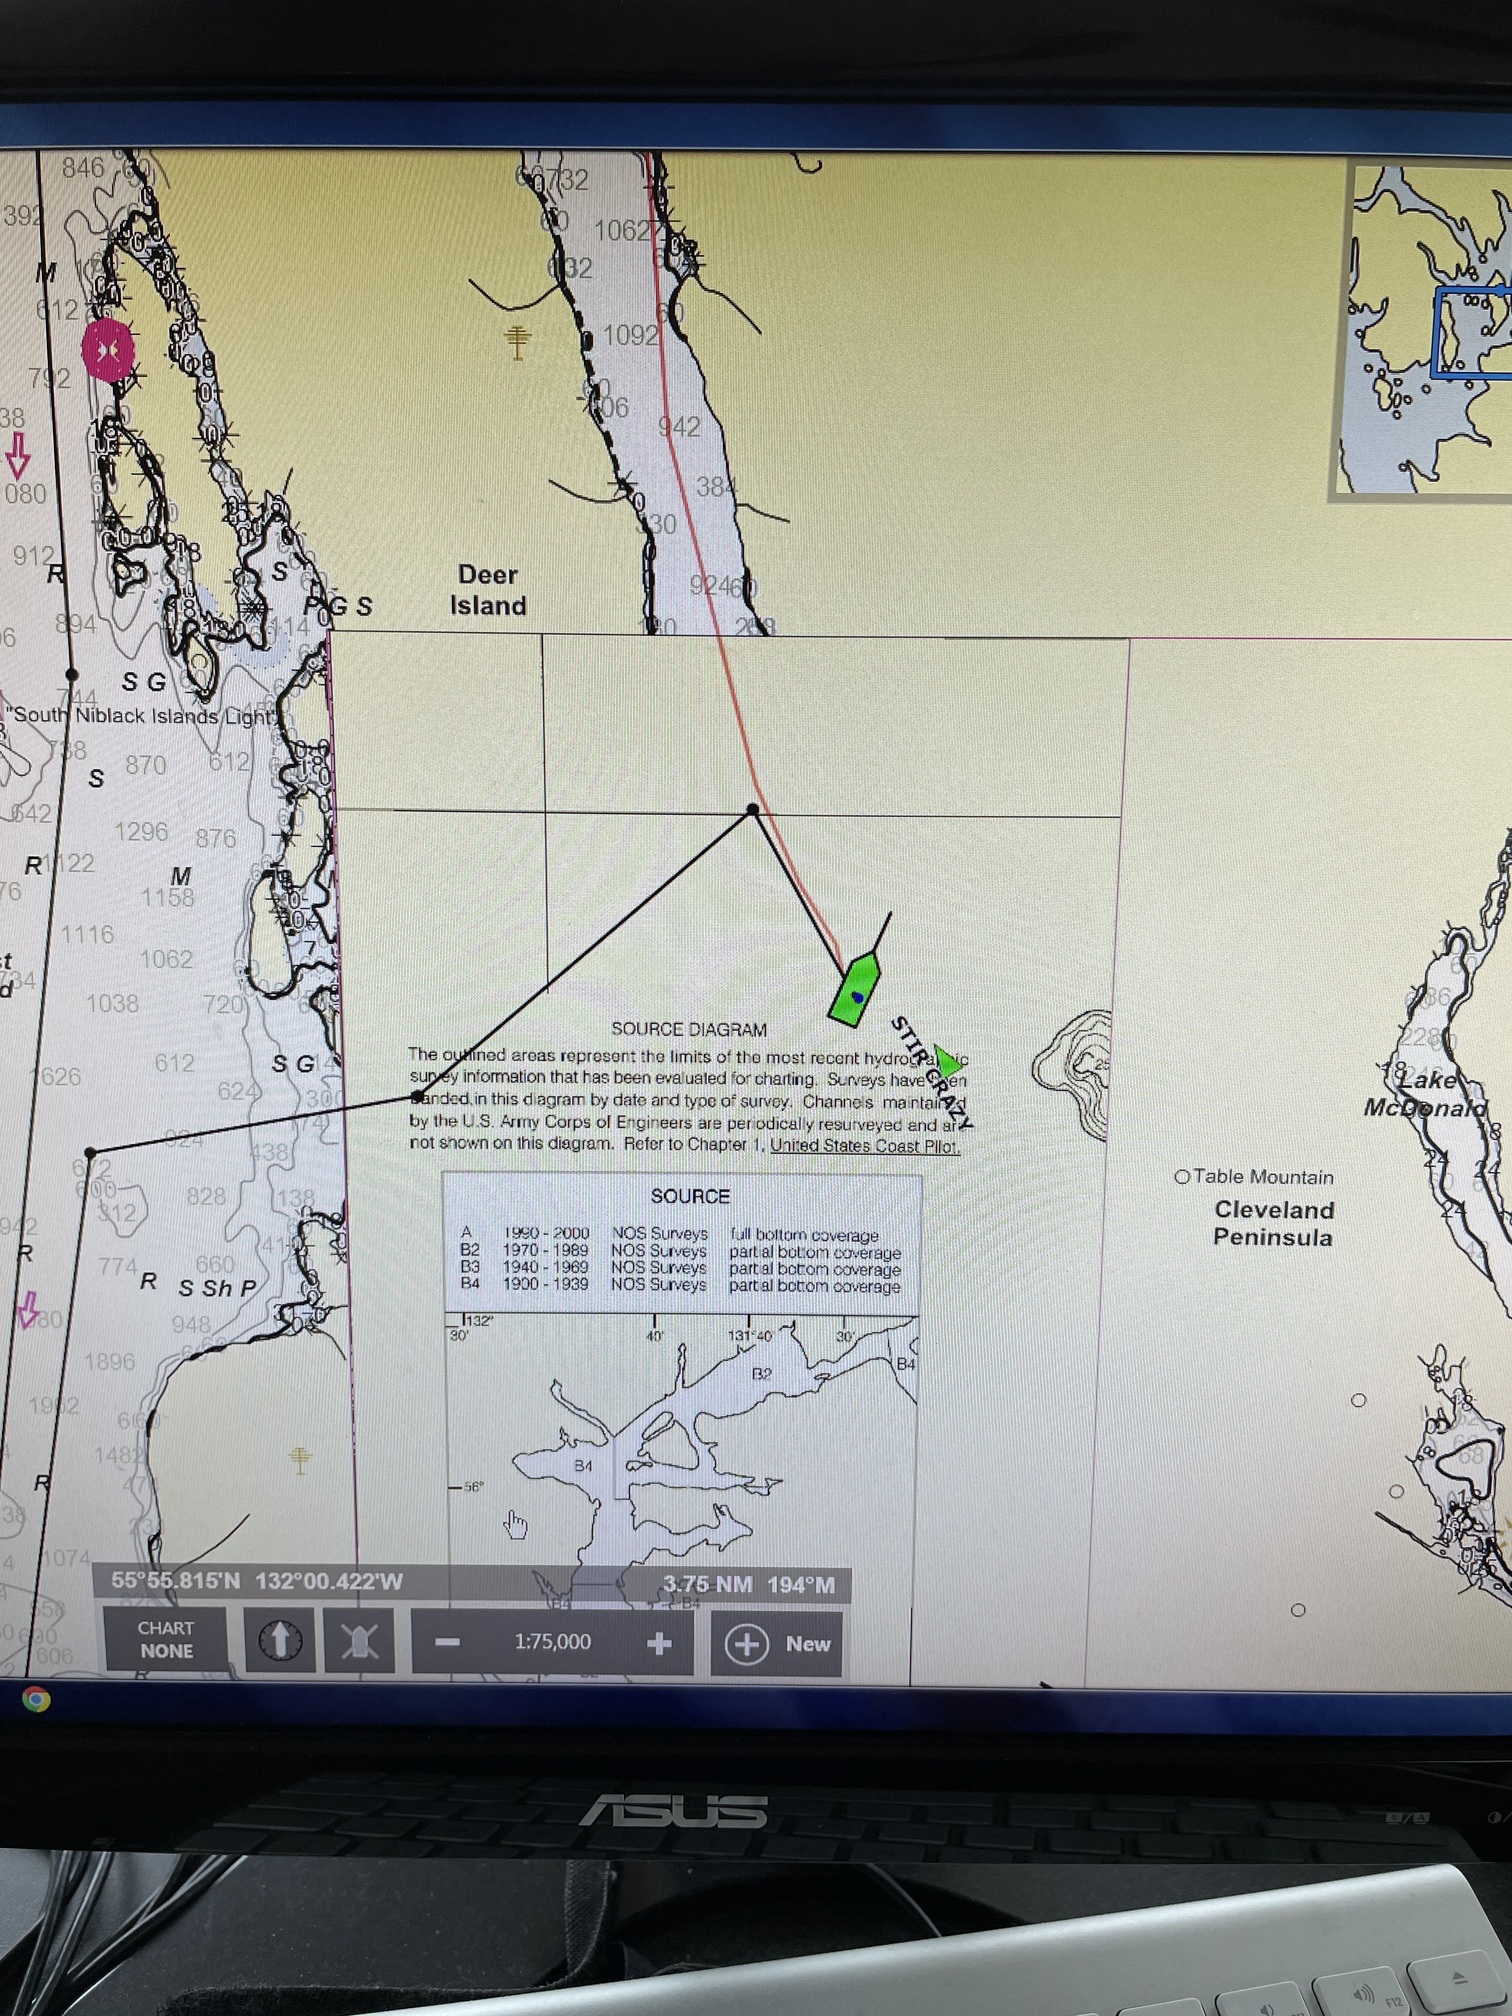
We were unable to zoom in to use the charts to anchor in Santa Anna Inlet. Once past 1:100,000 the inlet is covered with what looks like a portion of a paper chart. This is the first time adjusting zoom levels hasn’t worked for me. Attached are pictures.
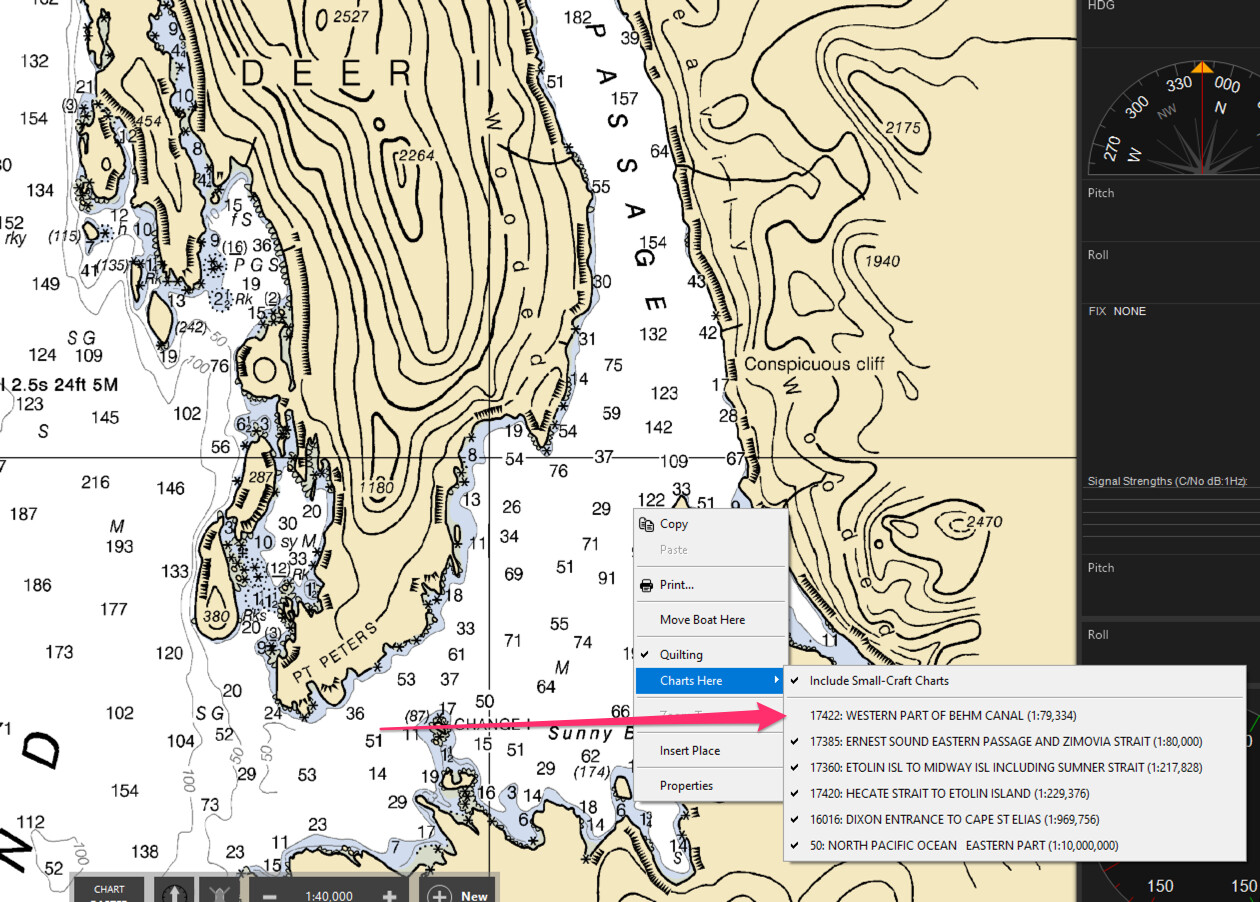
You may need to adjust the quilting for that area. See the screenshot where I unchecked chart 17422 (right click on a point within the area to get that menu). 17385 is what is showing. Oddly, you don’t seem to have the highest scale charts for the northern part of Deer Island either, which suggests either you are missing charts or disabled 17385.
Another workaround is switch to vector charts temporarily as they typically have fewer quilting issues, and you’ll need to become used to that anyway as raster charts are discontinued by NOAA.
Marcs,
Thanks for the reply, I was able to go to vector only and see the detail. Although, you did spur additional questions.
I have not messed with charts or disabled them, at least knowingly. 17385 is checked
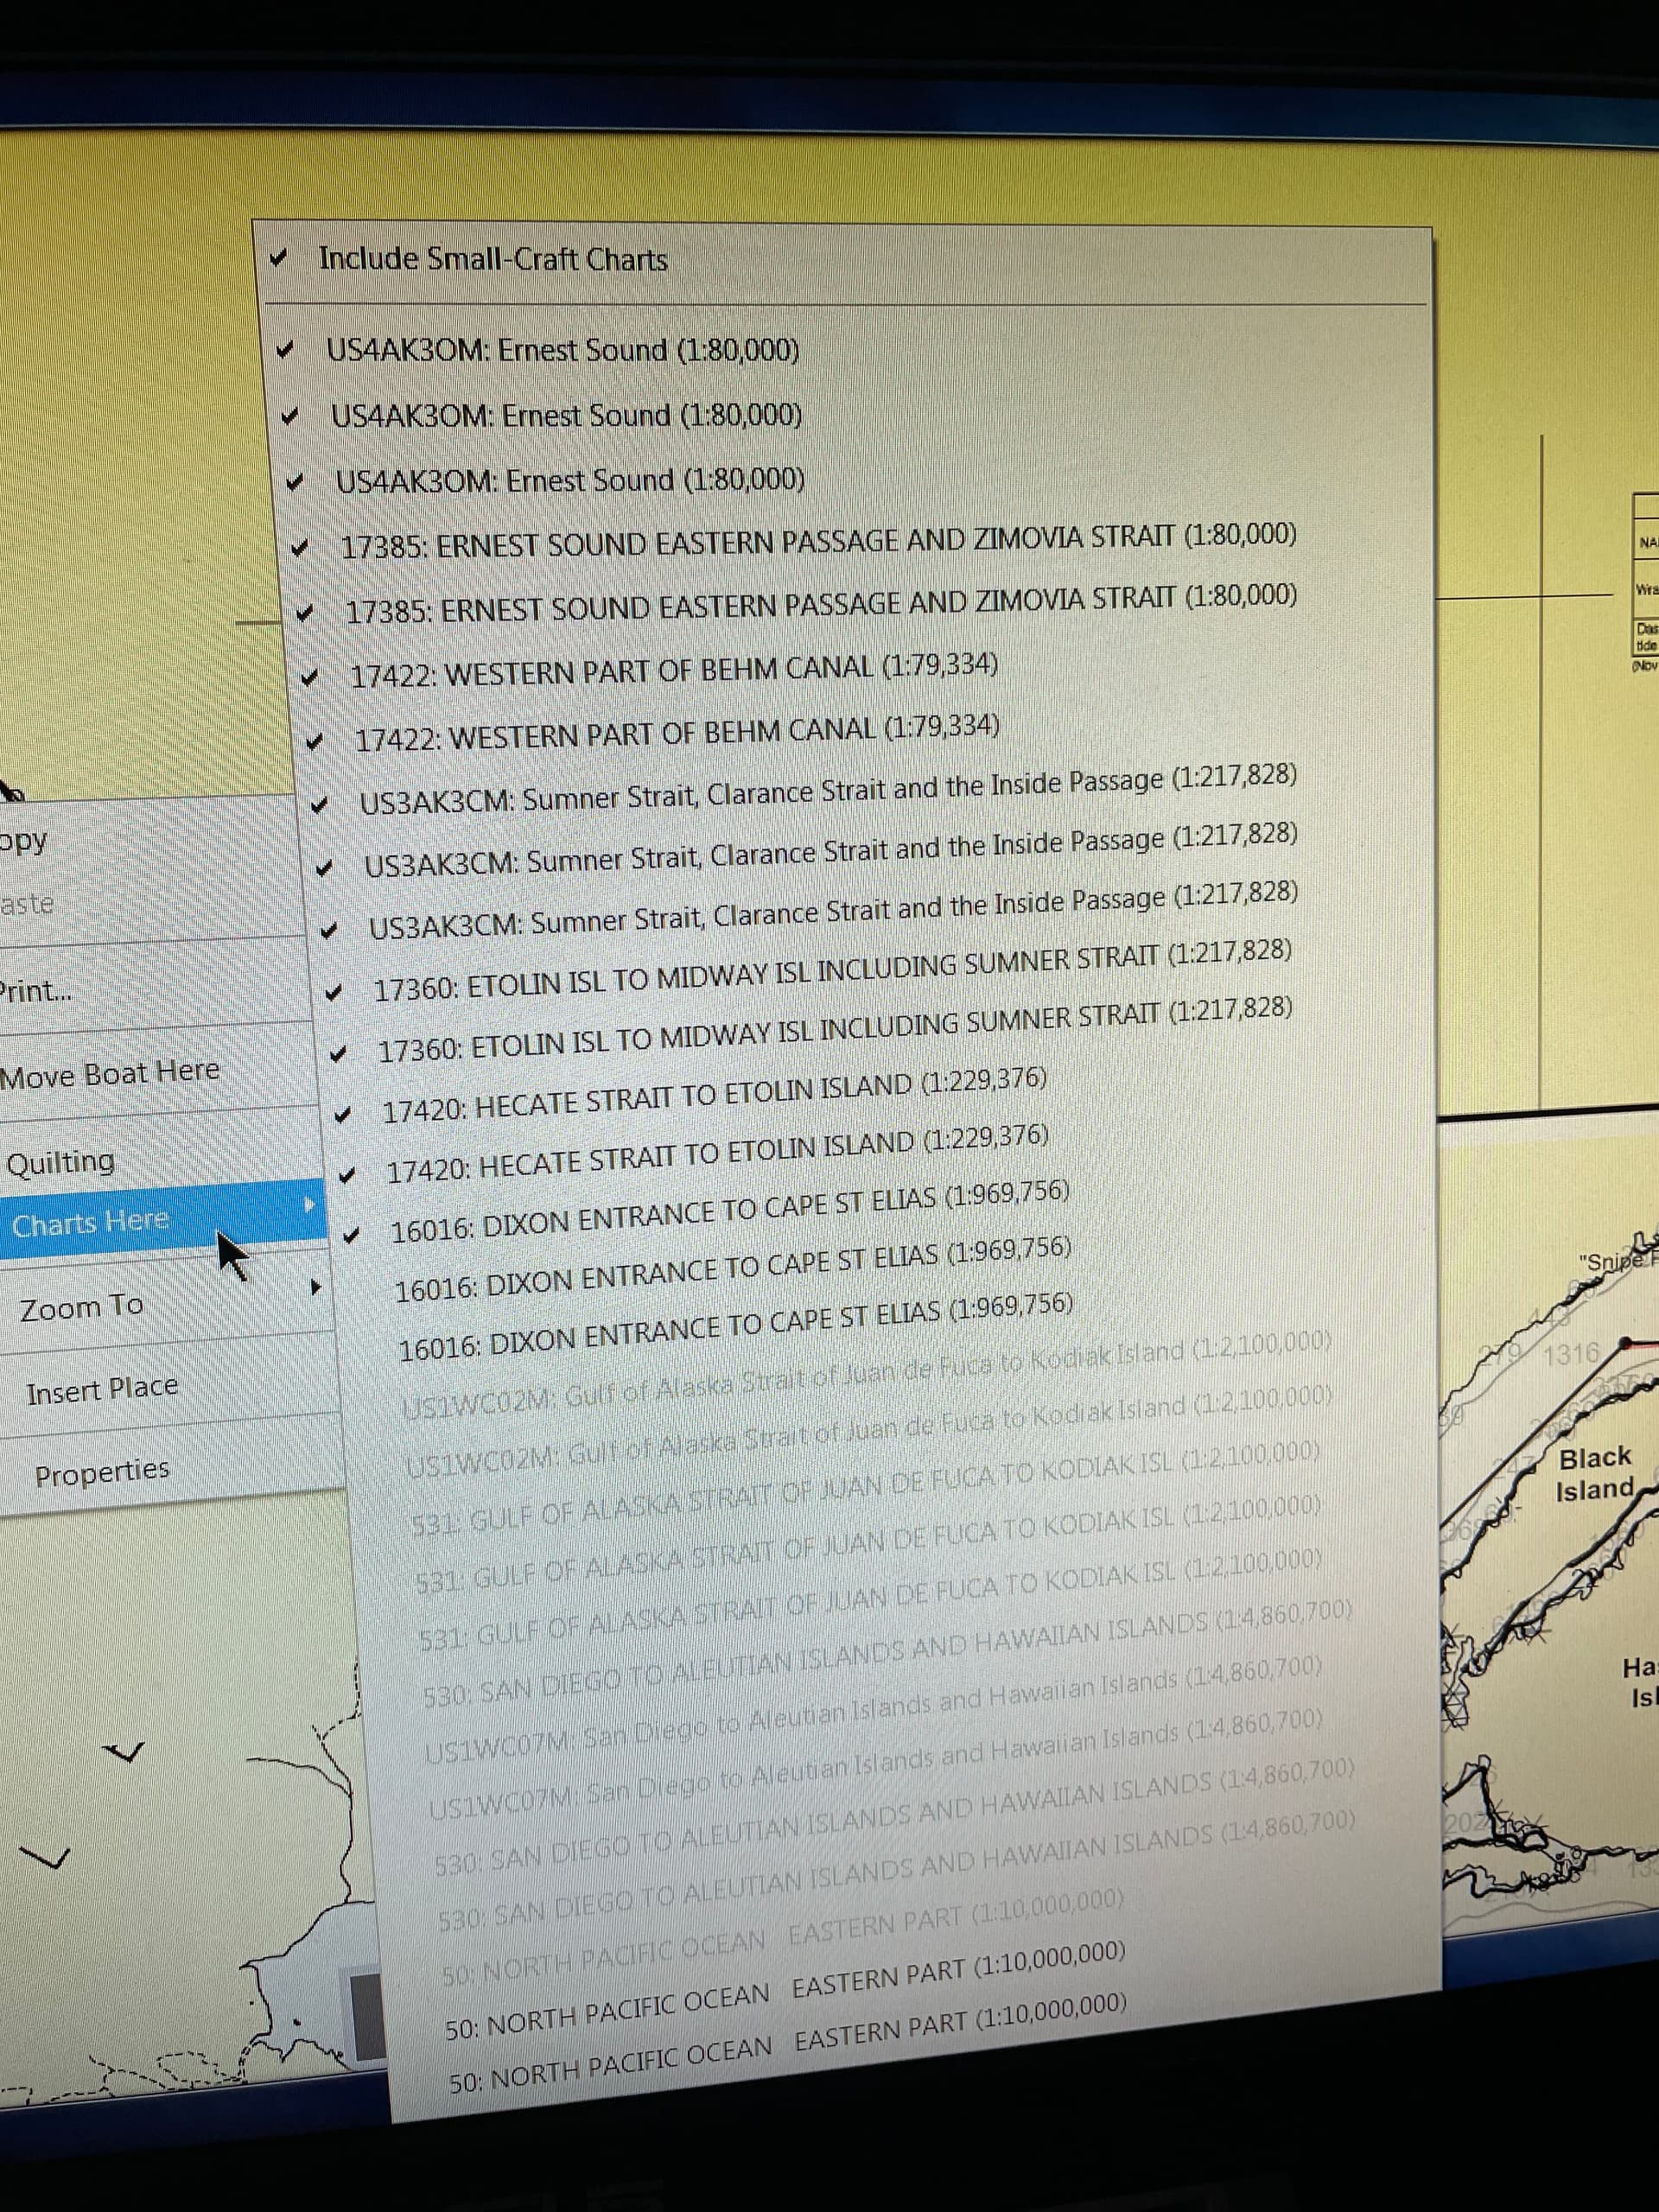
When I right click to get the chart listing with the most of the charts listed 3 times each. Is this a correct or do I need to do some kind of clean up?
How do I know if I have the highest scale charts? I am accepting updates every few days?
3.When you mention adjusting the quilting, I assume that means moving from vector to raster or both, is that correct?
Thanks
Tim
No, you should only have one of each. I’m not sure how you ended up with duplicates or the best way to clean them up, maybe someone from Rose Point can chime in (I’m a fellow user). If not, contact support directly and they can help. I’m not sure if it is contributing to your original problem or not. Perhaps you copied charts from an old computer and also have them being downloaded?
Assuming your chart library is properly setup, when you select a region (eg. USCG17 Alaska) it should include and update all relevant charts.
What I mean by adjusting the quilting is unchecking 17422, or in your cases both of them. 17422 is technically a very slightly higher scale than 17385 so CE defaults to preferring it, but due to how CE has to “guess” to stitch together the raster “paper” chart images, sometimes it picks the less useful one. Think of it as if you had all the paper charts laid out on a gymnasium floor and your task is to cut and glue them together to provide a unified view. It should be fairly rare you need to do this.
I think you may have multiple things going on so (3) may or may not work / make sense until you figure out (1).
Yes, this is one of the downsides to raster charts. Raster chart producers frequently do not cut out legends and not parts of a paper chart that aren’t strictly speaking chart.
These days, the best solution to this problem is to use vector charts. NOAA is very quickly cancelling raster chart in preparation for their complete end in 2025. This means that raster coverage is getting worse and worse, while vector coverage is being improved and refactored.
To give you a sense of how extremely bad raster charts are today:
Date
Total Charts
Removed
1/25/2018
1231
1/10/2019
1007
224
1/2/2020
1007
0
1/7/2021
1007
0
2/6/2022
997
10
6/2/2022
898
99
1/5/2023
716
182
8/3/2023
514
202
As you can see, NOAA has been very busy cancelling raster charts, especially this year.
So, in my opinion, now is the time to become more comfortable with vector charts. Raster charts should not be relied upon for quality coverage now, and it will get even worse with each passing update.
As marcs mentioned, vector charts do not generally have the problems with not having legend areas clipped out, and in the rare cases where there is a problem, we can look forward to that getting better as NOAA streamlines and uses the new gridded structure for vector charts.
As far as the duplicates are concerned, we’d need to get remote access to see what you have and where you have it, but it definitely appears that you have duplicates in two other places on your hard-drive, which we can fix once we’re remoted into your system. We’ll make sure there are no duplicates confusing things and that you are properly subscribed to the regions you want, so you continue getting and displaying the most recent charts.
Marcs, thanks for the reply.
Stevenh, thanks for the reply. I will call once we get home later in the month. I want to play it on the safe side, no hdd surgery on the road.
Thanks
Tim