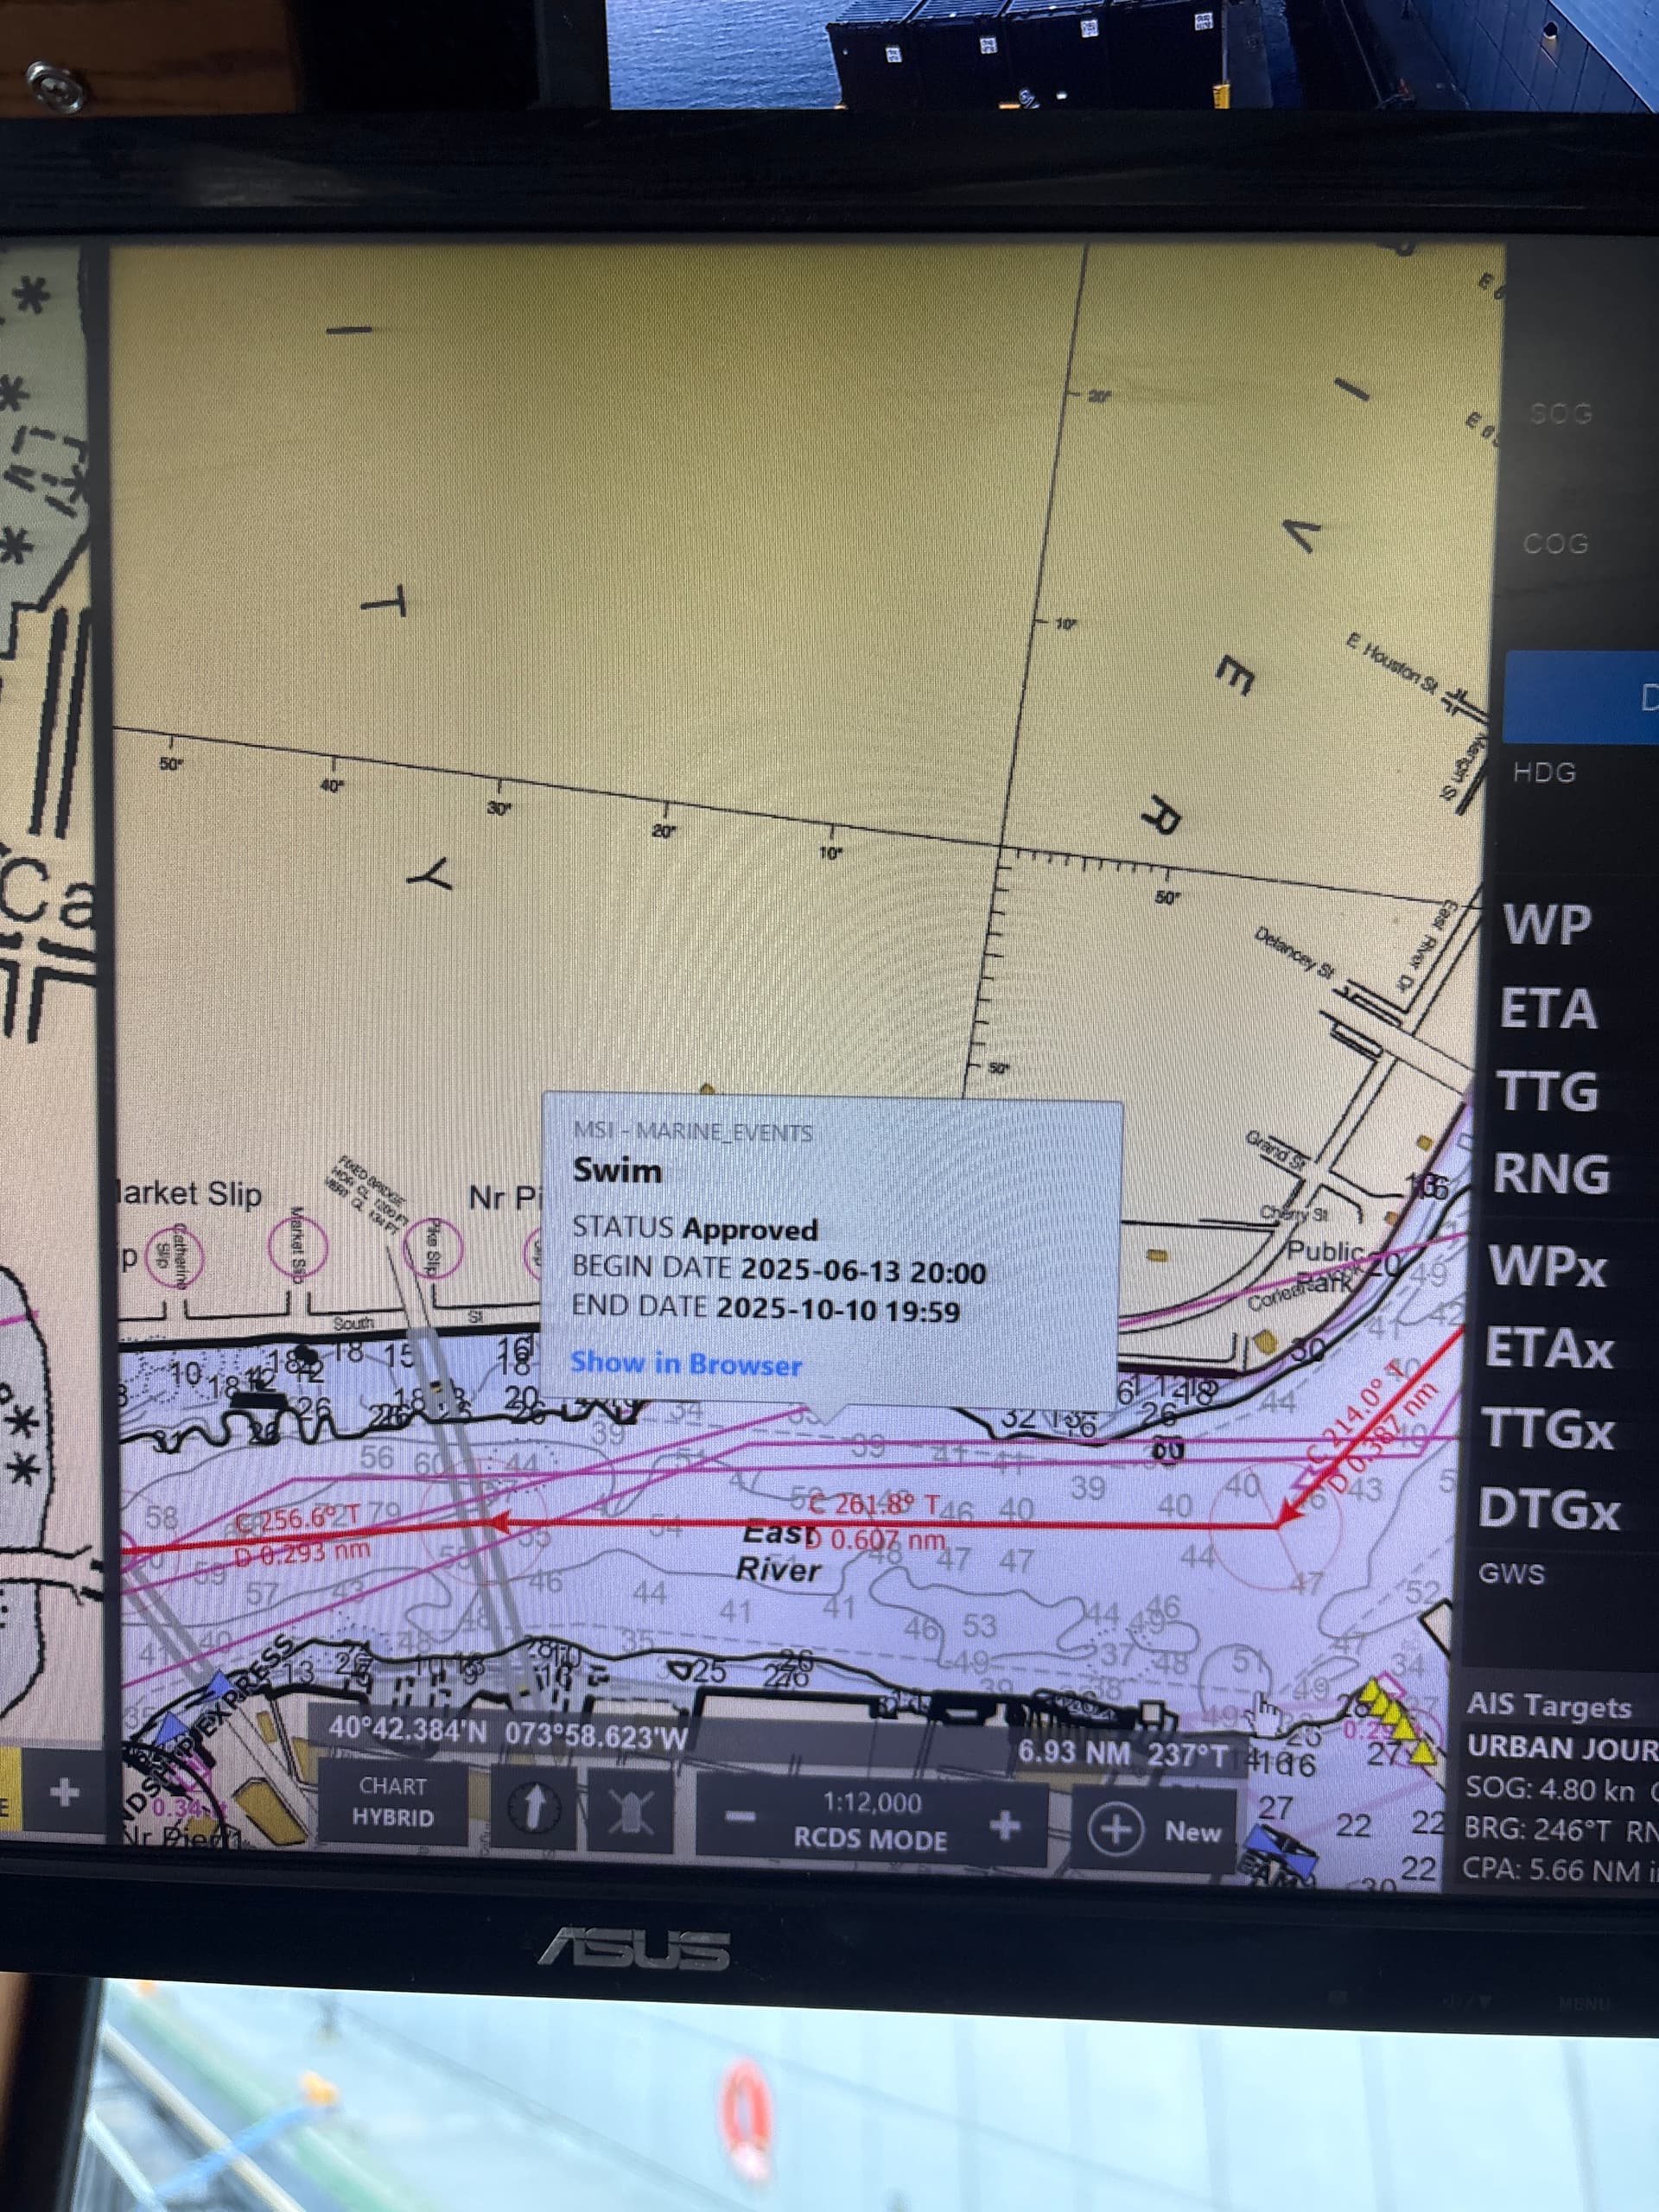
At 1:25,000 and in, “
swim line” tracks show in NY Harbor. Is there a way to hide these or remove, they clutter up my screen more than I prefer.
At 1:25,000 and in, “
Unfortunately we cannot remove those. Only NOAA can (they are part of the chart). You can reach out to NOAA directly to notify them if the lines are still there after an event is over.
My shipmates had the same question just last week.
Actually, those are not part of the chart and NOAA can’t do anything about them. Rose Point gets the information from the Coast Guard and we overlay it on the charts. When we designed the feature, very few of the MSI covered areas and what we did seemed reasonable. However, it’s clear the CG is now adding so many areas that it is very distracting and we are working on toning it down for the next update.
It’s great to get this information on the chart like you have done, maybe if it could be something like layers where you can toggle on off as needed ![]()
Brad - Are the swim lines are coming from the USCG LNM database? If so, what other LNM data is imported in?
ECS only? What about Coastal Explorer?
I like the fix for what it’s worth, I noticed it in the portal with the information button highlighted, left clicked and got the information in the browser and area displayed on the chart, closed and area on chart turns to a barely noticeable line. I checked it out on our ECS +Inland and the only difference that I saw was no highlight on the information button that indicates information in that area that might be worth investigating, I would think incorporating this into ECS +Inland would be helpful. Thanks as always Brad and the Rose Point family ![]()
![]()
![]()