The Canadian Government implemented an “Interim Sancuary Zone” for Orca whale protection on the east side of North Pender Island and east side of Saturna Island the past two years from June 1 - November 30. Nothing has been established YET for 2023. My question is that the Navico charts (that I use in addition to the CE Canadian Charts) show the restricted areas, but the CE Canadian Charts do not. I am happy to send you screen shots if you’d like. My question is how do the CE supplied Canadian charts get updated and is there any special procedure I need to follow to get the latest? This is motivated by my part by a very sternly worded Warning Letter from the Canadian Government that we unwittingly violented the “no go zone” last July 2022. Thanks in advance, Dan
This doesn’t answer your question about updates, but I do see the areas marked on my 2021-2022 (expired) Raster charts and 2022-2023 Vector charts. They aren’t marked as clearly as I’d like as far as actual location, but any way they do it can be confusing if they change.
I was annoyed by this as well and made my own chart boundary object which I uploaded here if it is useful to anyone: https://drive.google.com/file/d/1QaZjJUY9XXOJUTbH3VeDhSRi41SAxOxE/view (can’t attach .nob files here) These are from 2021 so need to be reviewed for any changes in 2023. I would love if the government maintained up to date importable objects for such restricted areas that change more frequently.
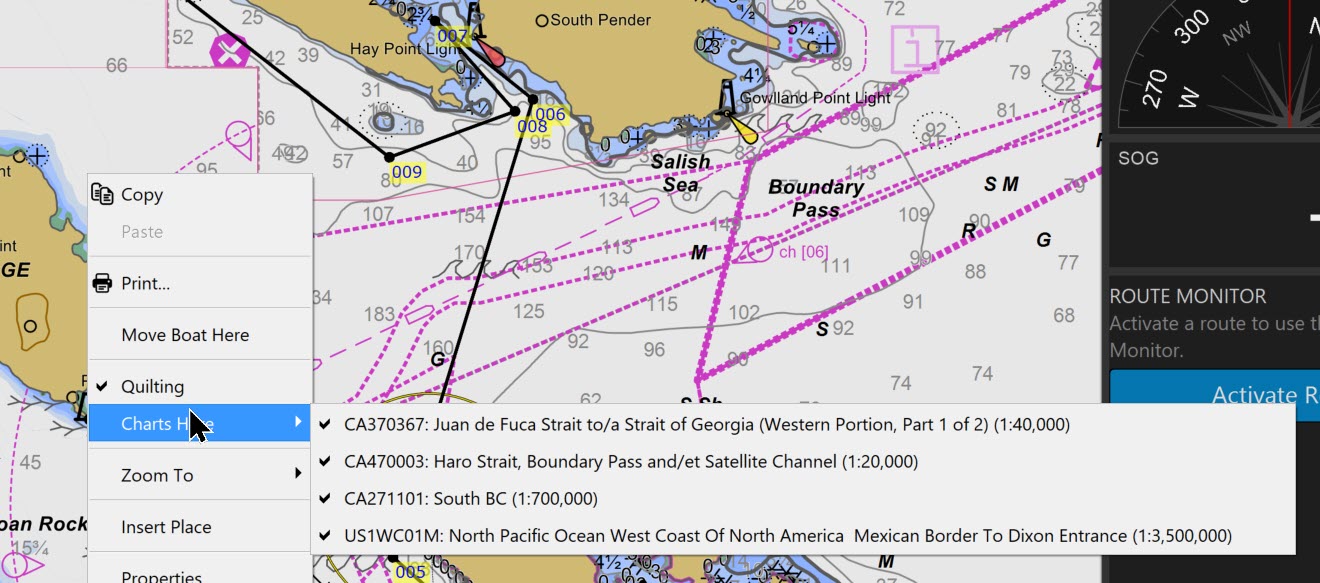
One thing to be careful of is CE may quilt US charts for those areas instead of the Canadian ones, so take note of what chart you are viewing. If you are in the area and have an AIS transmitter, the CCG will routinely hail you on 16 to advise you so keep a listening watch.
Thank you @marcs for showing how this looks and for sharing your boundary object file! (Also, after seeing that you couldn’t upload .nob files here, I found and enabled the option that should allow it.)
As far as how updates work: we get charts updates approximately once a month from CHS and make them available on our servers so Coastal Explorer can download them during its normal synchronization process. If you haven’t disabled the option to synchronize at startup, then Coastal Explorer will check for any updates to your charts every time it is started. It will also check if you use the Sync Now button near the top of the Settings page.
Thanks very much @Marcs & Brad for your information.
@marcs -
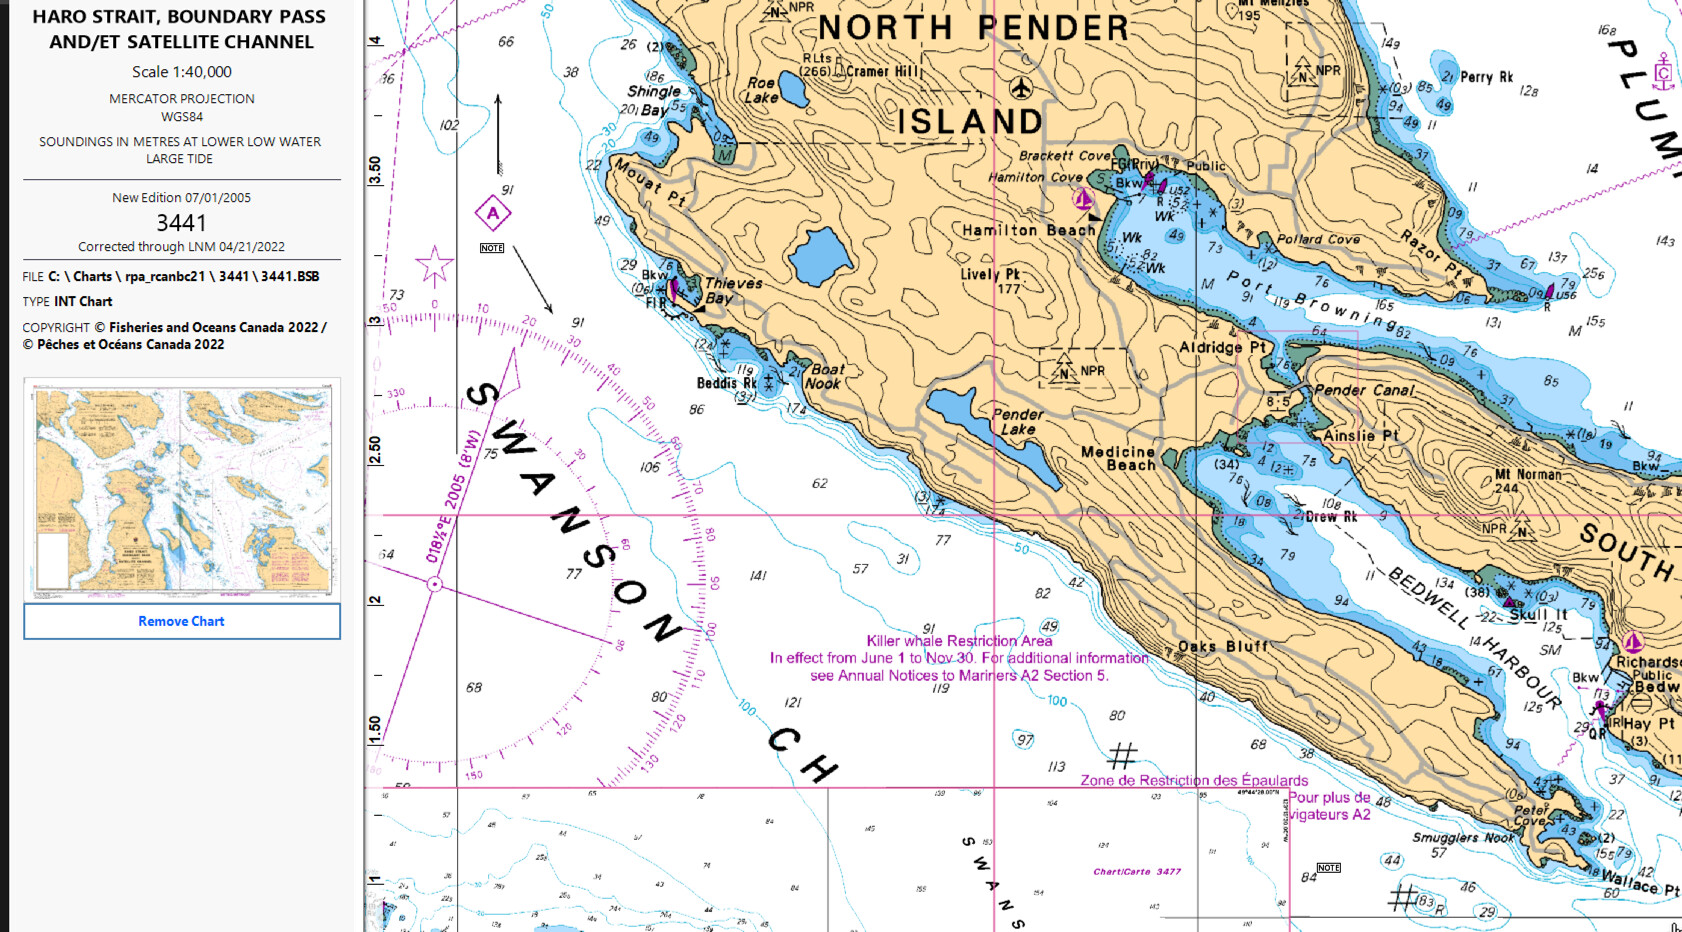
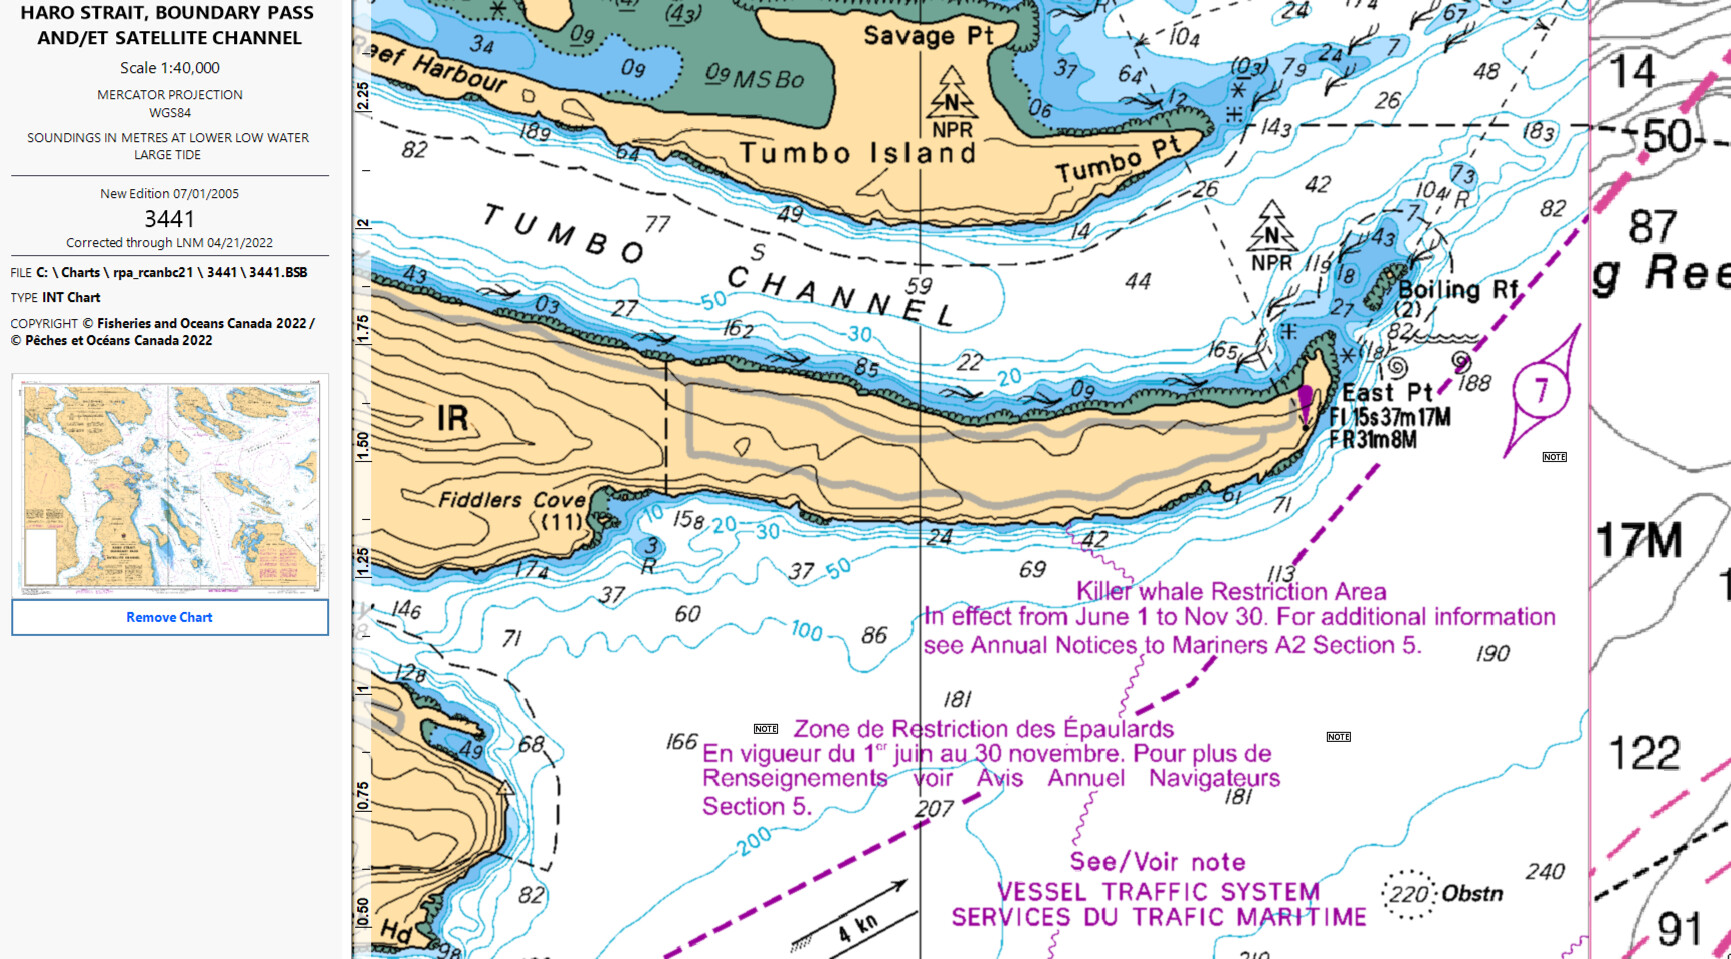
I don’t seem to have the chart that you are displaying with the ‘restricted text’ - is that part of the CE Canadian package? See a screen shot of the charts I have in the area, as well as the path I took along North Pender last summer to get a letter from the Canadian Government. I do have an AIS and that is apparently how they discovered we unwittingly were in the not go zone. We did not get a call on VHF from the CCG.
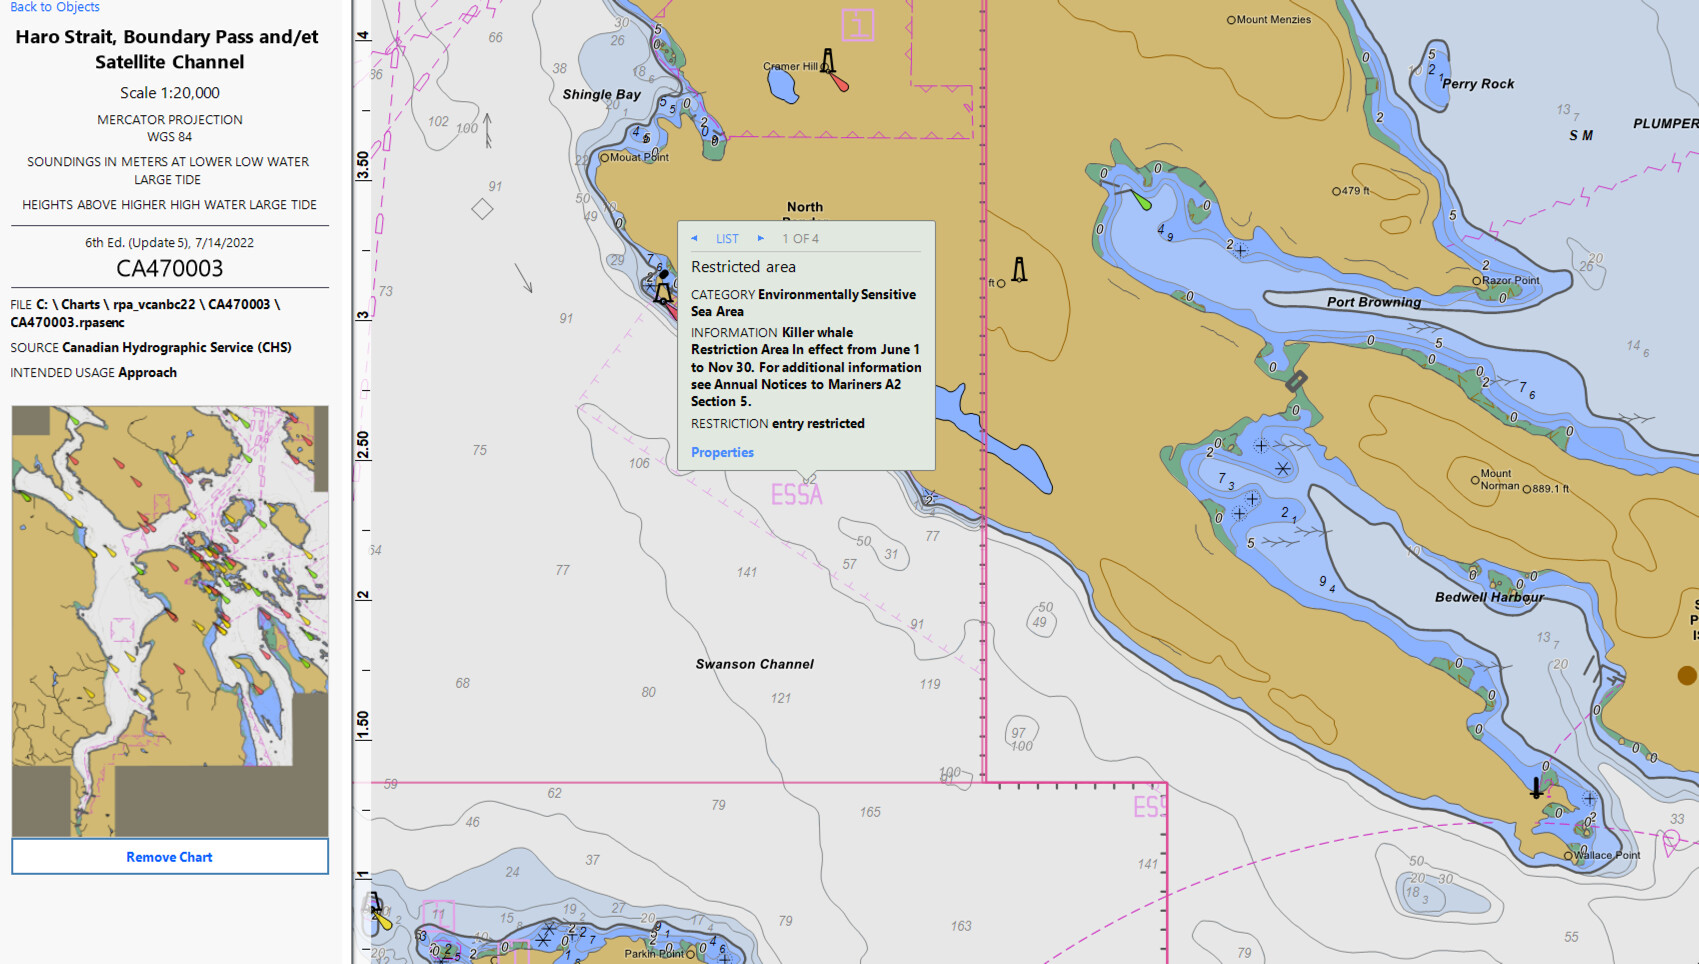
The chart with the “Killer whale Restriction Area” notice displayed on the chart is part of the “Rose Point Raster Charts for British Columbia” product. You have the “Rose Point Vector Charts for British Columbia” product which shows ESSA (for Environmentally Sensitive Sea Area) in the area outlined by T symbols.
Brad - thank you for the information. It is curious to me that there is a difference between the Raster and Vector charts. I understand that Rose Point provides users that the Canadians provide to you - but do you have any comments / thoughts?
For your information, I have been a CE user for several years and use it on my boat along with a B&G Charl Plotter that is running Navico charts. Because of Covid disjointed cruising seasons the past two+ years, I was not diligent in updating my charts. It is interesting to note that the Navico charts that I just updated have two restricted zones and on ‘no-go’ zone in the area. I put together the screen shots from their Android app with multiple panes but fro some reason I can’t attach the file to this Reply? , I’ve been looking at the Canadian Government website as to whether the “Interim Sanctuary Zones” will be in place in the Southern Gulf Islands, this year, but the website says they will announce this spring…Interim Order for the Protection of the Killer Whale (Orcinus orca) in the Waters of Southern British Columbia, 2022.
Thanks again, DanR
I received one of those nasty grams from the usually polite canadians a couple years ago. The funny thing is that we were actually working for Canada’s DFO (dept of fisheries and oceans) at the time of the so called “violations”, once when we were AIS located alongside pender harbor while doing acoustic measurements for THEIR killer whale studies and another “violation” while setting fish tag receivers out on the swiftsure bank. The folks that handle the enforcement end of DFO are obnoxious and rude. I think they hire them out of NY. They like to throw around threats of huge fines and restriction of fishing privileges. The nasty gram they sent me threatened a $10,000 fine for transiting the area that at the time was NOT marked on the chart. I wrote back suggesting that they have the right hand actually talk to the left as we were on contract with them both times of the “violations” and reminded them their charts were not marked properly. They never bothered to write back or apologize for the error. I highly suggest not getting a fishing license in Canada while travelling there, I did once and never will again.
Thanks for the comments and experience. I must have had the same letter as the $1 Million fine got my attention right away! I did exchange emails with the Transport Canada organization that sent me the warning notice but, like you, not any useful resolution. They claim that the Interim Sanctuary Zones were well published and include on charts - but I think it was ‘sptty’ at best. I think that if they are serious about the protection, they should have VHF broadcast announcements similar to “WG” Whiskey Gulf notices. I’m still confused why the CE Raster Charts have the notice while the Vector charts do not, and I will see if I can find out if why.
Plus it should only matter IF there are whales present, pretty hard to disturb something that isn’t there. I sent them a screen shot of the chart on CE and also that the charts were current, so they really didn’t have a leg to stand on. All in all, a pretty rude exchange. They never acknowledged my email response either.
My interaction with the DFO about my fishing license, I finally copied the head of the organization with my complaint and they dropped the case like a hot potato.
Typical government agency as far as I can see.
I like how the Can CG frequently broadcasts info and they say “more info on the continuous broadcast”, but they never say where to find that continuous broadcast. Turns out it’s on (I think) 21b, which you have to change your radio over to CAN frequencies to hear.
At least for the Vector charts, I have found that the ESSA’s only show up on the large scale charts(most detailed) for a given area such as the Pender Island shore. In one area the ESSA shows up at 1:25000, and then not until 1:1750 when a Harbor Chart is available. In addition to the ESSA’s, I have found this for the navigation objects such as buoys.