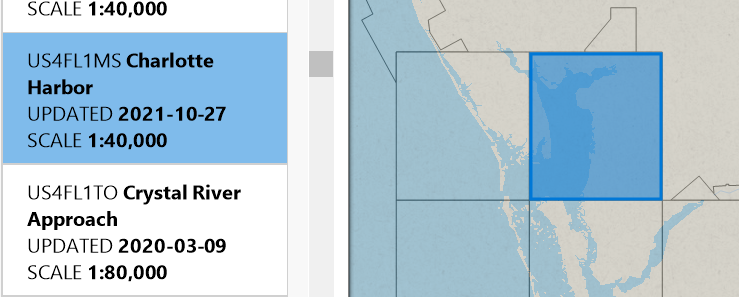
It’s really just there to fill in some blank areas between other charts. Make sure you have US4FL1MS for most of Charlotte Harbor and US4FL1MR for the area West of the entrance. You might also need a couple charts to the South…
I went in to the chart store and for some reason the ENC charts were not installed for Florida west coast and gulf coast… clicked install and now have the \vestor charts for the area…
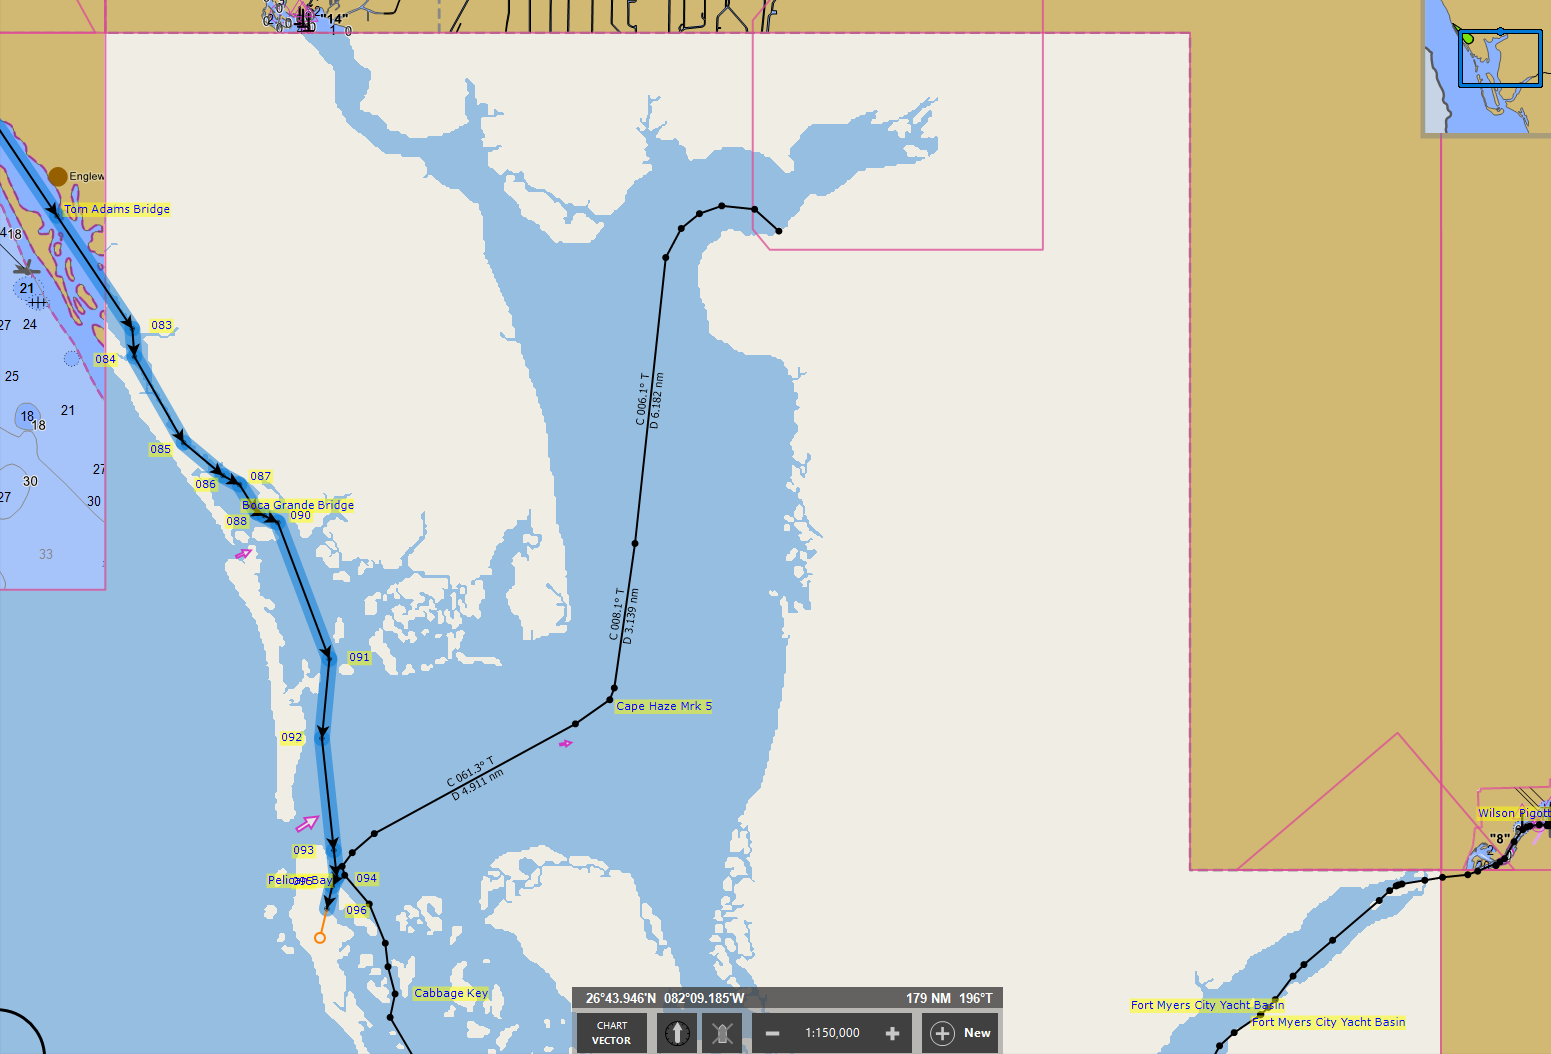
Same here, I can’t see any charts from Pelican Bay with resolution better than 1/200.000. Are there any?
Added: I realized there are a LOT of Pelican Bay Charts, I’m talking about Charlotte Harbor in Punta Gorda. I do see the funny shaped one mentioned by Brad though.
@PPLepew: Have you made sure you have the Florida region installed?
NOAA is in the process of “re-scheming” all of their vector charts (see Rescheming and Improving Electronic Navigational Charts for more info). Part of this means that the identification of and areas covered by every single chart is changing. And that means that some areas for which you’ve had up-to-date charts might not be kept up-to-date anymore if you’ve only had individual charts installed since those charts may no longer exist.
However, if you use the option in Coastal Explorer to install complete regions of charts, then any new charts that NOAA adds to that region will automatically get installed by Coastal Explorer (and charts that NOAA removes will be hidden).
To install a complete region, use “Settings > Charts and Add-Ons > Store > NOAA > NOAA ENC Vector Charts” and click Install on each region you want from that page.
@PPLepew: Your screenshot is part of “Settings > Charts and Add-Ons > NOAA ENC” and is showing the charts that you have installed, but only outlines. (The purpose of that part of Coastal Explorer is to show you what chart coverage you have, not to show you the actual charts.) It indicates that you do have coverage of the areas in question at 1:40,000 scale.
If you close the browser and pan/zoom to that area on the regular chart screen, you should see the actual chart.
@PPLepew: If you have the same chart installed in two different directories on your PC, both will show up in that list. That is not normally a problem other than the wasted disk space. If you are concerned about it, give our support guys a call and they can help you clean things up.
Are you now able to see the charts that were not appearing for you before?
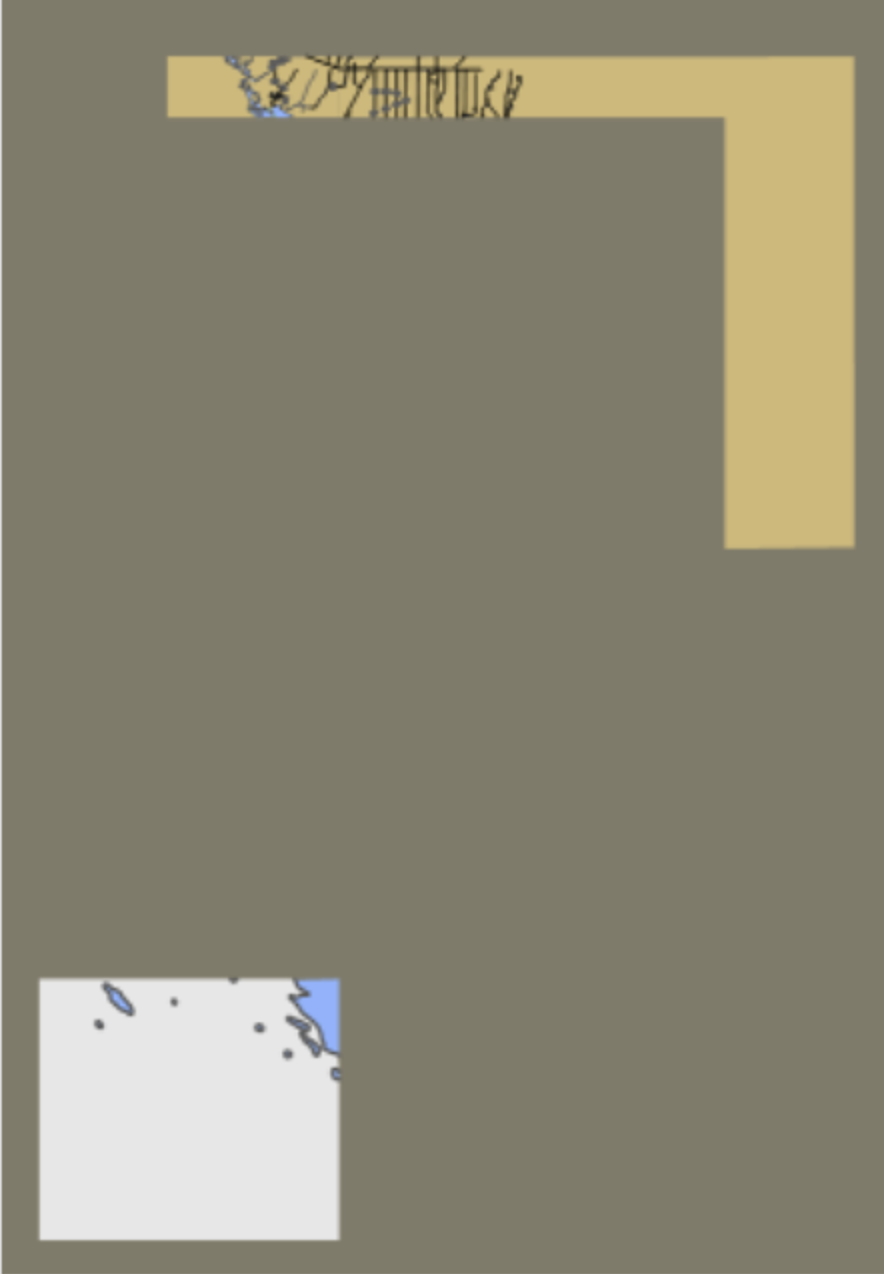
I still have the same problem as CaptJFL above, where the charts show as white/blue in 60 to 150k zooms, where I expect to see some details.
They show fine out of that range
Let’s have you give our support department a call, so we can check into the duplicate charts Brad was discussing with you and make sure you have all the charts for any given region you need.
Our number is: 425-6-5-0985
Our hours are: M-F 7am-5pm PST
Hi Steven,
I have found the duplicate charts origin, I had a thumb drive with some backup charts on it.
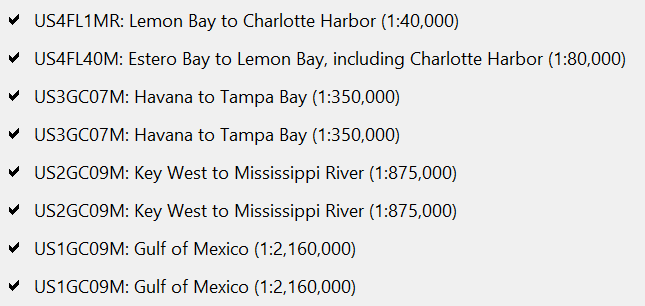
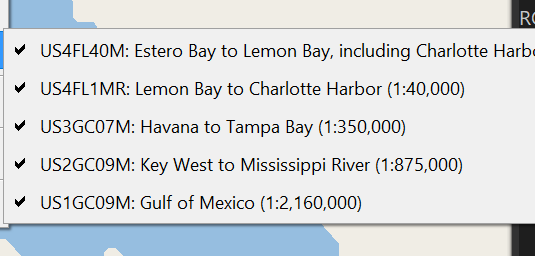
These are the charts I have now for Charlotte Harbor:
The US4FL1MR is shown as blue/white in Zooms of 60 to 150K